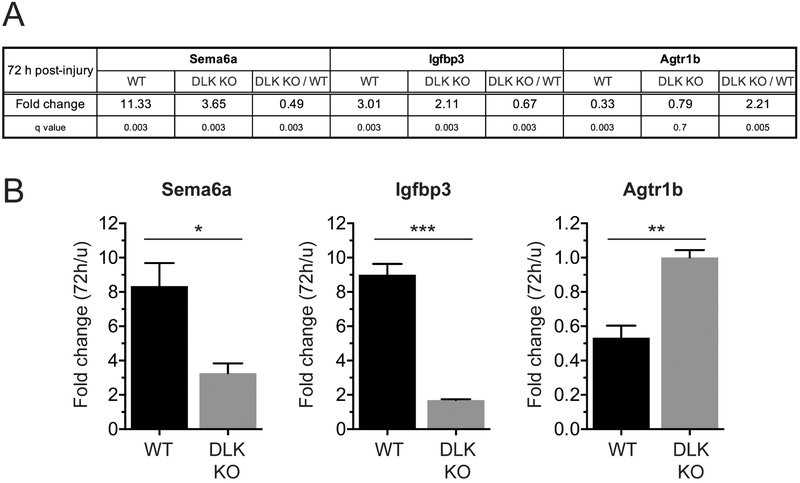
Figure 2.
Quantitative reverse transcription PCR (qRT-PCR) validates the DEGs identified by RNA-seq.
(A) The RNA-seq results are shown for selected DLK-dependent DEGs. WT and DLK KO: Expression levels at 72 h after injury are shown as fold change compared to the expression levels in uninjured condition (u). DLK KO / WT: Expression levels in DLK KO are compared to those in WT, at 72 h after injury.
(B) Graphical presentation of the qRT-PCR results for the same DEGs shown in (A). Expression levels at 72 h post-injury time point were compared to those of uninjured DRGs. n = 3; *p < 0.05, **p < 0.01 and ***p < 0.001 by t test.

