Figure 5:
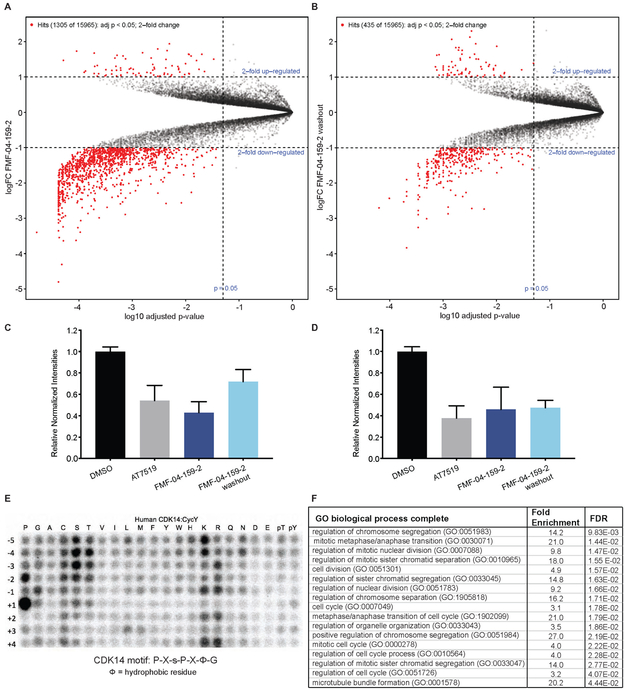
Cellular consequence of TAIRE kinase inhibition. (A) Volcano plot showing phospho-proteomics results for FMF-04-159-2 4hr treatment, analyzed using Bioconductor in R to assess fold change relative to DMSO. (B) Volcano plot showing phospho-proteomics results for FMF-04-159-2 4hr treatment followed by 2 h compound washout, analyzed using Bioconductor in R to assess fold change relative to DMSO. (C) Relative normalized TMT channel intensities for hits from FMF-04-159-2 direct treatment, reported as mean ± standard error. (D) Relative normalized TMT channel intensities for hits from FMF-04-159-2 washout condition with strong scores for CDK14 phosphorylation motif consensus, reported as mean ± standard error. (E) In vitro kinase assay results for phosphorylation of peptide library array by CDK14/Cyclin Y. (F) Top ten GO enrichment terms (Ashburner et al., 2000) for significantly downregulated phospho-peptides identified as hits from compound washout with strong scores for CDK14 phosphorylation motif consensus. FDR reported from Fisher’s exact test. See also Figure S5 and Figure S6.

