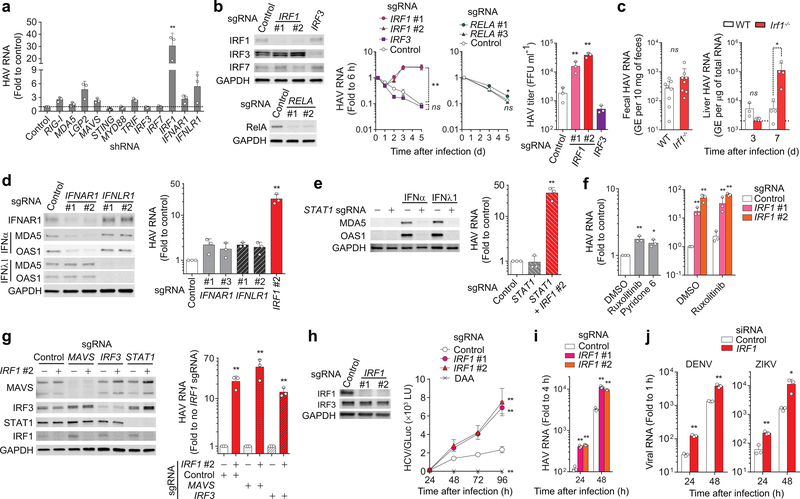
Figure 1. IRF1 restricts RNA virus infections in hepatocytes.
(a) Intracellular HAV RNA on 5 d.p.i. in PH5CH8 cells transduced with lentivirus expressing shRNAs targeting different genes. **p < 0.001 vs. control [two-way analysis of variance (ANOVA) with Dunnett’s multiple comparisons test]. (b) Kinetics of HAV RNA replication over 5 days in PH5CH8 cells expressing IRF1 vs. IRF3 vs. RELA sgRNAs. *p<0.05, **p<0.01 vs. control (two-way ANOVA with Dunnett’s multiple comparisons test). Immunoblots of IRF1, IRF3, IRF7, and RelA in the knockout cells are shown on left. Viral titers on 5 days p.i. are shown on the right. **p<0.01 vs. control (one-way ANOVA with Dunnett’s multiple comparisons test). (c) Fecal HAV shedding on days 5 and 7 postinoculation (left, data are pooled from 2 different time points), and intrahepatic HAV RNA on days 3 and 7 (right, each symbol = one animal) in wildtype (WT) vs. Irf1−/− C57BL/6 mice. *p<0.05 vs. WT (two-sided unpaired Mann-Whitney test). (d) HAV RNA on 5 d.p.i. in PH5CH8 cells expressing IFNAR1 or IFNLR1 sgRNAs vs. IRF1 sgRNA. Immunoblots of IFNAR1 and ISGs (MDA5 and OAS1) induced either by recombinant IFN-α (100 U ml−1 for 24 h) or IFN-λ (10 ng ml−1) in these knockout cells are shown on left. **p<0.01 vs. control (one-way ANOVA with Dunnett’s multiple comparisons test). (e) HAV RNA on 5 d.p.i. in PH5CH8 cells expressing STAT1 sgRNA and both STAT1 and IRF1 sgRNAs (right). **p<0.01 vs. control (one-way ANOVA with Dunnett’s multiple comparisons test). Immunoblots showing the absence of ISG expression in response to type I and type III IFNs (left). (f) HAV RNA on 5 d.p.i. in PH5CH8 cells in continued presence of JAK inhibitors, 3 μM ruxolitinib or 0.3 μM pyridone 6 (left). *p<0.05, **p<0.01 vs. control (one-way ANOVA with Dunnett’s multiple comparisons test or two-sided t-test). Knocking out IRF1 enhanced HAV replication in the presence of ruxolitinib (right). *p<0.05, **p<0.01 vs. control (two-sided unpaired t-test). (g) Effect of double-knockout of IRF1 in the absence of MAVS or IRF3 expression on HAV replication. Relative HAV RNA levels on 5 d.p.i., normalized to those without IRF1 sgRNA were set to 1 (right). Immunoblots are shown on left. **p<0.01 vs. control (two-sided unpaired t-test). (h) Immunoblots of IRF1 in control and IRF1 knockout Huh-7.5 cells (left). GLuc secreted from Huh-7.5 cells infected with JFH1-QL/GLuc virus (103 FFU ml−1) over ensuing 96 h (right). **p<0.01 vs. control (two-way ANOVA with Dunnett’s multiple comparisons test). (i) HAV RNA levels in IRF1 sgRNA-expressing vs. control Huh-7.5 cells infected at an m.o.i. of 1 over ensuing 48 h. **p < 0.01 vs. control (two-sided unpaired t-test). (j) DENV and ZIKV RNA levels in IRF1 vs. control siRNA-transfected Huh-7.5 cells infected at an m.o.i. of 1 over ensuing 48 h. **p<0.01 vs. control (two-sided unpaired t-test). Data are means ± s.d. from 3 independent experiments (a,b,d-h, j) or from 3 technical replicates representative of 2 independent experiments (c,i). The precise p-values are shown in Supplementary Table 9.

