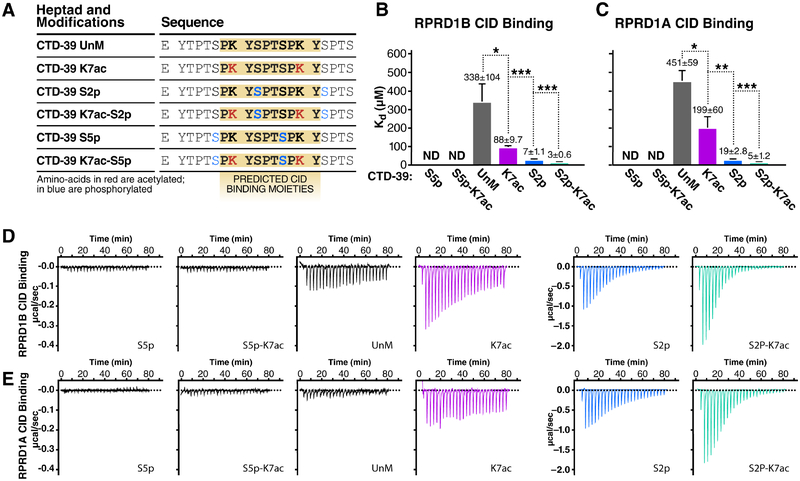
Figure 2: RPRD CID Domains Recognize Acetylated and Phosphorylated CTD Peptides.
Isothermal titration calorimetry (ITC) experiments measuring in-vitro binding affinity between RPRD1A and RPRD1B CID domains and modified CTD peptides.
(A) Table of CTD-39 peptides with indicated post-translational modifications and predicted RPRD CID binding moieties.
(B) Kd values measured by ITC for RPRD1B CID and modified CTD-39 binding.
(C) Kd values measured by ITC for RPRD1A CID and modified CTD-39 binding.
(D) Representative ITC plots showing effect of K7ac on RPRD1B CID-CTD interactions for the indicated modifications
(E) Representative ITC plots showing effect of K7ac on RPRD1A CID-CTD interactions for the indicated modifications.
Data is shown as mean ± SEM. * p < 0.05; ** p < 0.01; *** p < 0.005 using a one-tailed T test.

