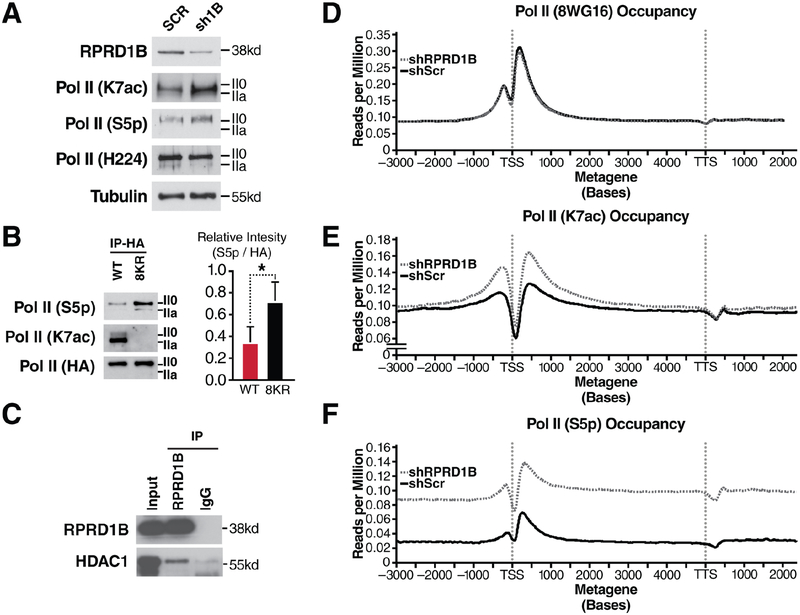
Figure 5: Increased S5p and K7ac Levels in Response to RPRD1B Knockdown.
(A) Western blotting of indicated RNA Pol II modifications in NIH3T3 cells treated with scrambled shRNAs or those targeting RPRD1B.
(B) Western blotting against S5p and K7ac from HA-immunopurified lysates containing WT or 8KR RNA Pol II and densitometry using ImageJ of three independent HA-elutions.
(C) RPRD1B immunoprecipitation from 293T cell lysates and western blotting against nuclear histone deacetylase HDAC1.
(D-F) Metagene profiles of expressed genes in NIH3T3 cells. Gene profiles are measured in reads per million, relative to input control. Metagene profiles were generated from ChIP-seq data from NIH3T3 cells expressing either scrambled or RPRD1B targeted shRNAs treated with vehicle control. S5p is measured using the RNA Pol II 4H8 antibody. Profiles are representative of two independent experiments.
Data is shown as mean ± SEM. * p < 0.05; using a one-tailed T test. See also Figure S2 and Table S2.

