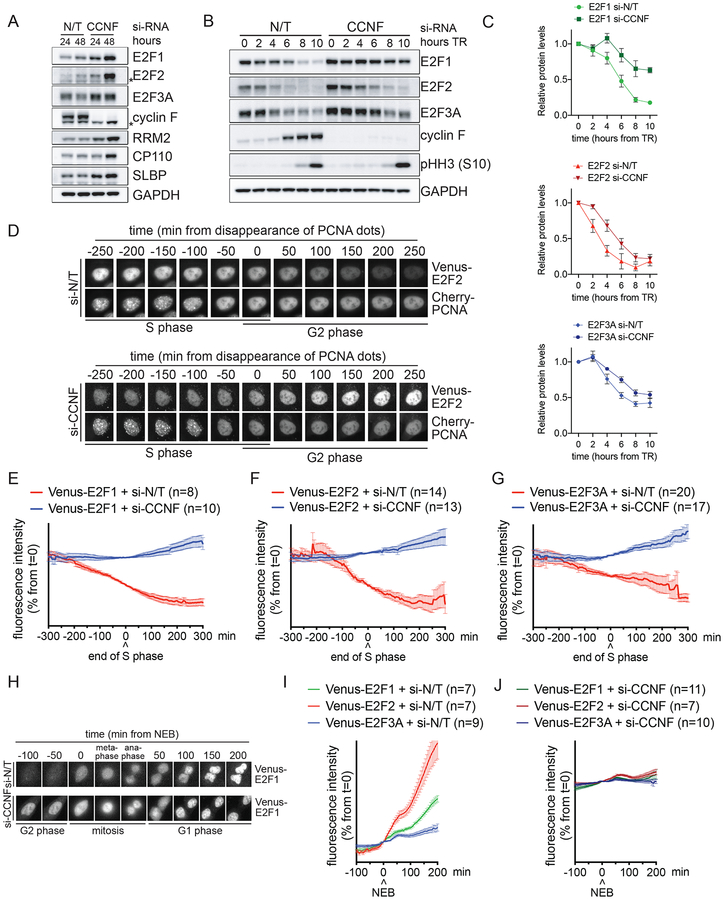
Figure 2. The degradation of E2F1/2/3A in late S and in G2 is mediated by cyclin F.
A. U2OS cells were transfected with either a non-targeting (N/T) si-RNA or CCNF si-RNA for the indicated hours. Cells were then collected and processed for FACS analysis (Fig. S2A), qRT-PCR (Fig. S2B) and Western blot. The asterisks indicate non-specific bands.
B. RPE-1 cells were transfected with either a N/T si-RNA or CCNF si-RNA, synchronized by a TR for the indicated hours. Cells were then collected and processed for FACS analysis (Fig. S2E) and Western blot.
C. Quantification of the densitometric intensity of four independent experiments, included that shown in (B) represented as percentage change compared to time 0 (mean ± SEM).
D. Live U2OS cells stably co-expressing Cherry-PCNA and Venus-E2F2 were imaged by fluorescence microscopy. Still images of control cells (upper panel) and cells treated with CCNF si-RNA (bottom panel) are shown at the indicated times.
E-G. Live U2OS cells stably co-expressing Cherry-PCNA and either Venus-E2F1 (E), Venus-E2F2 (F) or Venus-E2F3A (G) were imaged by fluorescence microscopy in three independent experiments. The intensity of fluorescence was plotted against the time from the disappearance of PCNA dots (time 0). The graphs show the average fluorescence (mean ± SEM) of individual cells after transfection with CCNF si-RNA (blue) compared to N/T si-RNA (red).
H. Live U2OS cells stably co-expressing Cherry-PCNA and Venus-E2F1 were imaged by fluorescence microscopy. Still images of control cells (upper panel) and cells treated with CCNF si-RNA (bottom panel) are shown at the indicated times.
I-J. Live U2OS cells stably co-expressing Cherry-PCNA and Venus-E2F1 (green), Venus-E2F2 (red) or Venus-E2F3A (blue) were imaged by fluorescence microscopy in three independent experiments. The intensity of fluorescence was plotted against the time from nuclear envelope breakdown (NEB) (time 0). The graphs show the average fluorescence (mean ± SEM) of all individual cells after transfection with N/T si-RNA (I) or CCNF si-RNA (J).

