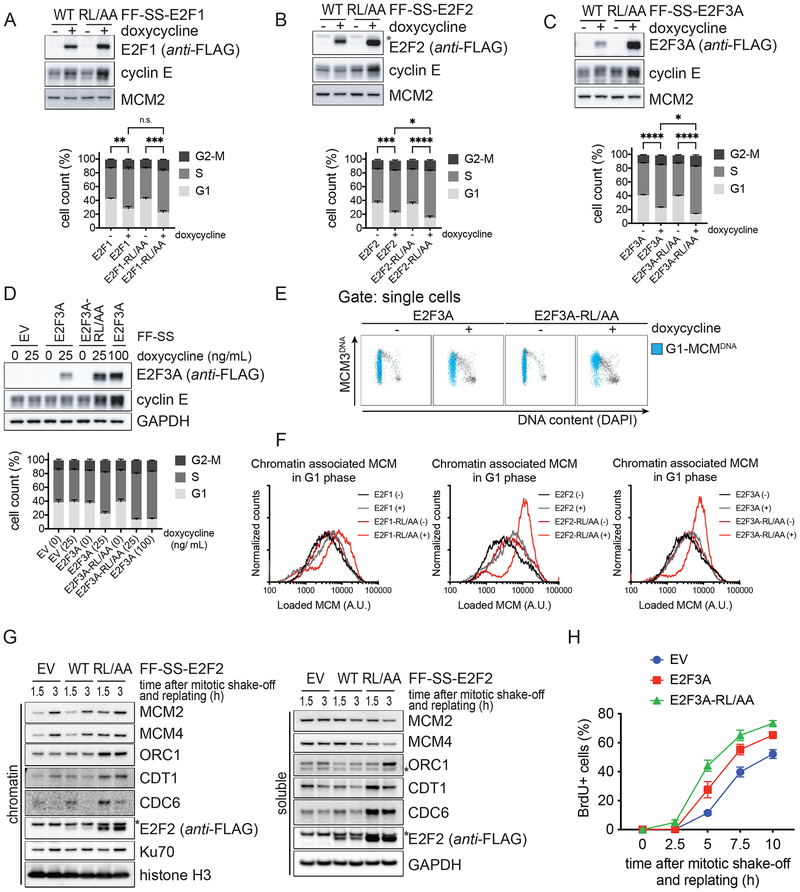
Figure 5. Stable E2F1/2/3A mutants deregulate cell cycle progression.
A-C. U2OS cells expressing inducible activator E2Fs or corresponding E2F-RL/AA mutants were treated with or without doxycycline and, 24 hours later, pulsed with BrdU and processed for Western blot (top) and FACS analysis (bottom). BrdU incorporation and propidium iodide (PI) staining were analyzed using flow cytometry. The bar graph shows the percentage of cells in the different cell cycle phases from five independent experiments (mean ± SEM; Ordinary one-way ANOVA and Holm-Sidak’s multiple comparisons test, on S-phase population).
D. The experiment was performed as in (C) using the indicated amounts of doxycycline.
E. U2OS cells expressing inducible E2F3A or E2F3A-RL/AA were treated with doxycycline and, two days later, pulsed with EdU and processed for chromatin flow cytometry. EdU incorporation, DAPI-, and DNA-loaded MCM3-staining were analyzed using flow cytometry. Cells with DNA-bound MCM3 in G1 are indicated in blue.
F. Histograms of G1 cells that contain DNA-loaded MCM represent the quantification of four independent experiments.
G. U2OS cells expressing EV, inducible E2F2, or inducible E2F2-RL/AA were synchronized as in (3K). Mitotic cells were harvested by mitotic shake-off, released from the block, and replated in fresh medium without doxycycline. At the indicated time points, cells were collected, and processed for chromatin-fractionation and Western blot.
H. U2OS cells expressing EV, inducible E2F3A, or inducible E2F3A-RL/AA were synchronized as in (3K), except that BrdU was added 2 hours after replating. At the indicated time points, cells were collected, and processed for Western blot (Fig. S5I) and FACS analysis to measure BrdU incorporation and PI staining. The graphs show the percentage of cells entering S phase as observed by BrdU positivity from three independent experiments (mean ± SEM).

