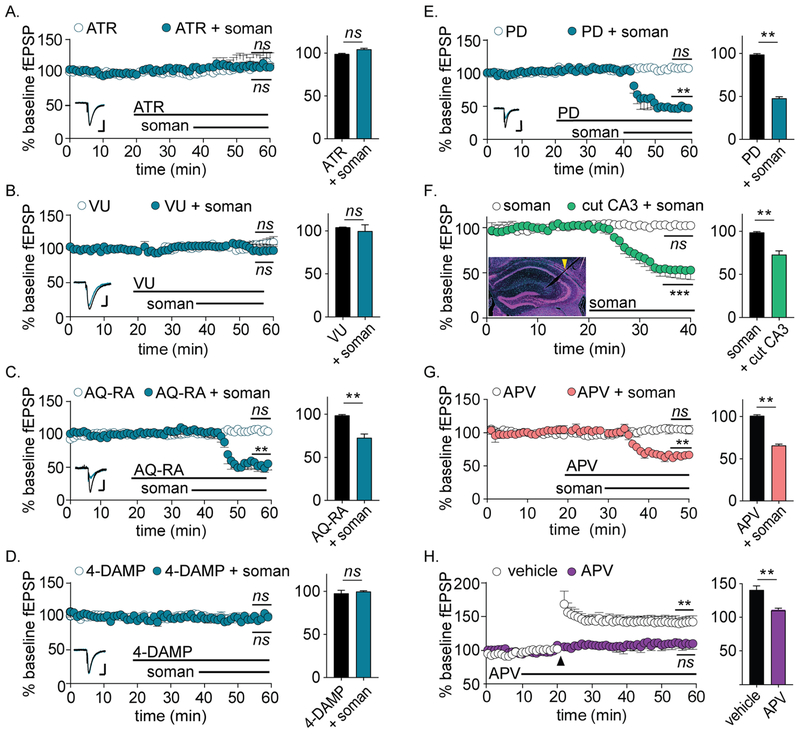
Figure 3.
OP-LTD requires M1 and M3 mAChR signaling, but does not require spontaneous neuronal activity or NMDAR currents. For all panels, statistical significances are determined between average fEPSP amplitudes during the final 5 min of baseline versus the final 5 min of treatment (indicated on plot) as well as between the final 5 min of treatment between vehicle and soman (bar graphs on right). (A) Non-specific mAChR antagonist atropine (ATR; 5 μM) blocks OP-LTD (n = 4 each; p = 0.36 versus baseline; p = 0.43 versus vehicle). (B) M1 mAChR antagonist VU 0255035 (VU; 1 μM) blocks OP-LTD (n = 4 each; p = 0.52 versus baseline; p = 0.60 versus vehicle). (C) M2 mAChR antagonist AQ-RA (1 μM) does not prevent OP-LTD (n = 4 each; p = 0.003 versus baseline; p = 0.003 versus vehicle). (D) M3 mAChR antagonist 4-DAMP (100 nM) blocks OP-LTD (n = 4 each; p = 0.71 versus baseline; p = 0.62 versus vehicle). (E) M4 mAChR antagonist PD 102807 (PD; 500 nM) does not prevent OP-LTD (n = 3 each; p < 0.001 versus baseline; p < 0.001 versus vehicle). For A-E, perfusion with mAChR antagonists alone had no effect on fEPSP amplitudes (white circles, n ≥ 4 for each). Representative fEPSPs for baseline (black) and following treatment (blue) are shown as insets in each plot. Scale bars = 0.20 mV by 50 ms. (F) OP-LTD occurs despite incision of CA3 afferent fibers (n = 3 each; p = 0.011 versus baseline; p = 0.003 versus vehicle). (Inset) Coronal hippocampal slice with representative incision at the Schaffer collateral fibers. (G) APV does not prevent OP-LTD (n = 4 each; p = 0.007 versus baseline; p = 0.004 versus vehicle), even though (H) APV blocks high frequency-induced long-term potentiation (n = 3 each; p < 0.001 versus baseline; p = 0.003 versus vehicle).

