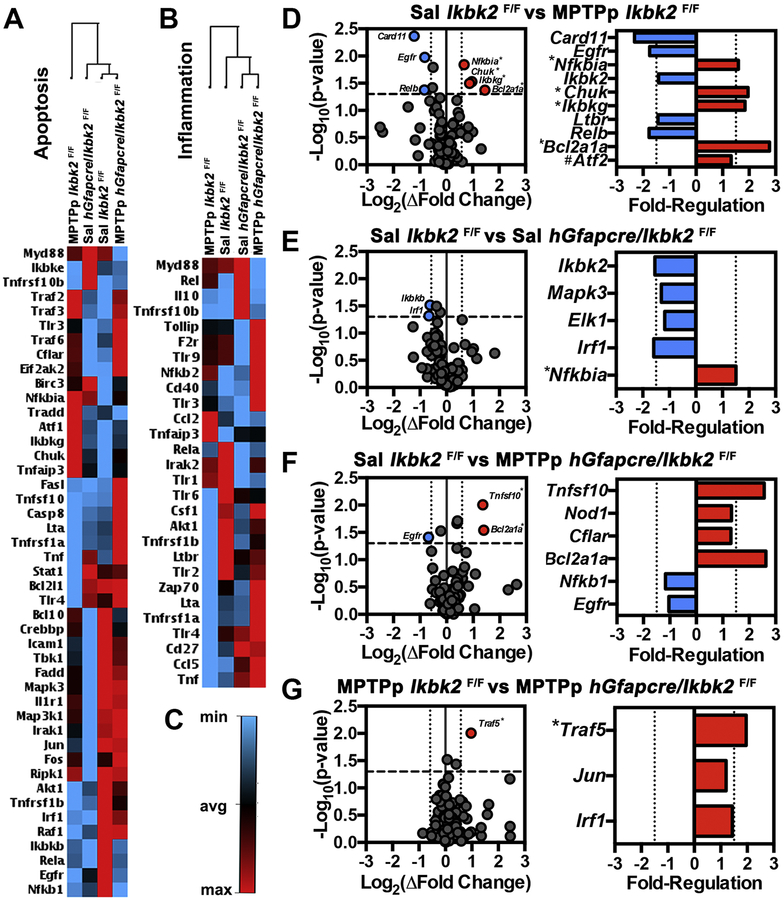
Figure 6.
Microarray analysis of NFκB signaling pathway genes from the SN following MPTPp treatment. Following saline or MPTPp treatment, mRNA from SN’s from Ikbk2F/F and hGfapcre/Ikbk2F/F mice were analyzed in an NFκB signaling microarray for alterations in inflammatory and apoptotic genes. A. Heat map representing fold regulation changes in NFκB signaling genes involved in apoptosis B. Heat map representing fold regulation changes in NFκB signaling genes involved in inflammation C. Color guide to heat maps with blue representing down-regulation and red indicating up-regulation D-E. Volcano plots (right) and fold regulation graphs (left) for changes in NFκB signaling genes for MPTPp treated Ikbk2F/F mice (D), saline-treated hGfapcre/Ikbk2F/F mice (E), and MPTPp treated hGfapcre/Ikbk2F/F mice (F) in comparison to saline-treated Ikbk2F/F mice. G. Volcano plots (right) and fold regulation graphics (left) for changes in NFκB signaling genes in MPTPp treated hGfapcre/Ikbk2F/F mice in comparison to MPTPp treated Ikbk2F/F mice. Volcano plots represent all genes evaluated in the microarray with colored dots meeting criteria of a p-value < 0.05 on (y-axis) and fold change above 1.5 (x-axis) while fold regulation is only genes whose p-value was < 0.05. All data was analyzed using SA biosciences software. * indicates that the calculated FDR was also < 0.05. # indicates a FDR < 0.05 but a p above 0.05.

