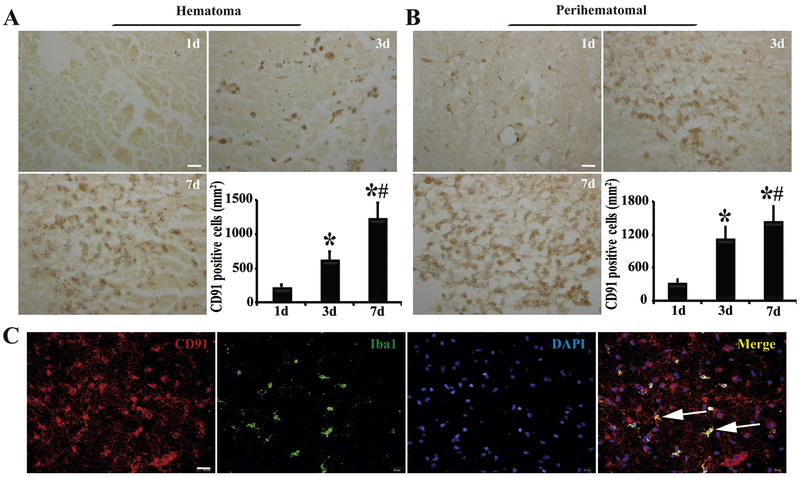
Figure 3.
Presence of CD91-positive cells in (A) clot and (B) perihematomal tissue 1, 3 and 7 days after ICH with quantification. Scale bar=20μm. n=4 for each group, *, p<0.05, compared with day 1; #, p<0.05, compared with day 3. (C) CD91-immunoreactivity colocalized with Iba1 in the perihematomal area at day 1. Scale bar=20μm. Arrows indicate double-stained cells.

