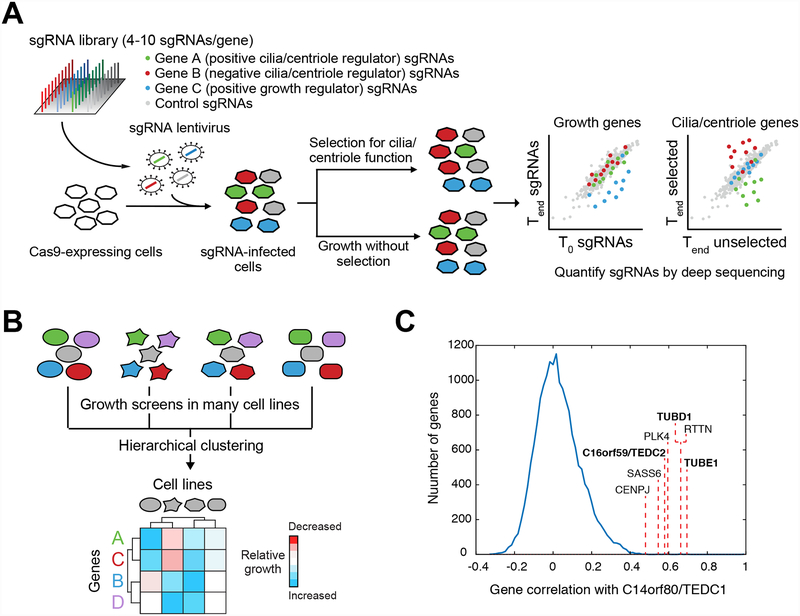
Figure 5. Application of functional screening to study cilia and centrioles.
A) Overview of pooled functional screening using CRISPR/Cas9. A pool of sgRNAs is introduced into Cas9-expressing cells by lentiviral transduction. Transduced cells can then be grown under conditions that select for a functional property of centrioles or cilia or in the absence of such selection (note that the cells in question may need to engineered such that centrioles/cilia control a selectable phenotype). Deep sequencing is then used to analyze the composition of sgRNAs present at the outset of the experiment (T0 – e.g. the sgRNA library used to make lentiviral particles), in the unselected pool at the end of the experiment (Tend unselected), and in the selected pool at the end of the experiments (Tend selected). If sgRNAs targeting a particular gene are consistently depleted (or enriched) in the final selected sample relative to the final unselected sample, then the gene in question regulates centriole or cilium function. Similarly, changes in sgRNA abundance between the T0 sample and the final unselected sample reveal genes that affect cell growth. B) Schematic illustration of using growth phenotype screens conducted in different cell lines (indicated by cells of different shape) to identify genes with shared function. Hierarchical clustering of growth phenotypes across all cell lines can be used to group and identify genes having a shared function. C) Several centriolar genes, including members of the TED complex (bold labels), exhibit highly correlated patterns of growth phenotypes to that of C14orf80/TEDC1 across 436 cell lines in the Achilles dataset (Avana public 18Q2). The growth phenotypes for knockout of C14orf80/TEDC1 were compared to those for all other genes in the dataset, yielding the plotted distribution of correlation coefficients. Correlation values between TEDC1 and other TED complex components are indicated.

