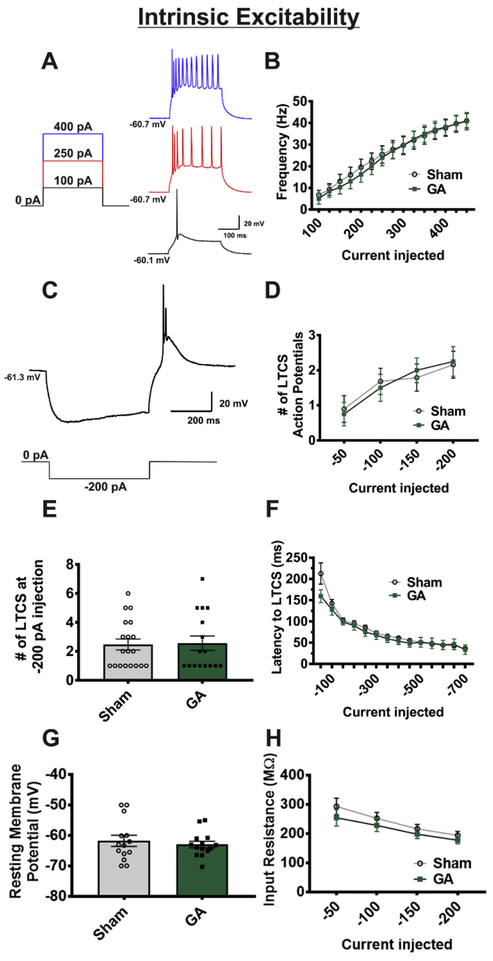
Figure 7. Intrinsic excitability of VB neurons is not altered by GA exposure.
A Figure showing select steps and representative traces of input-output protocol (sham cohort). B A graph depicting no statistical difference in the average firing rates of VB neurons across all depolarizing current injections between cells from sham and GA animals (sham n=19 neurons in 8 animals, GA n=19 neurons in 8 animals; F(2,41)=. 167, p=.847) C, Figure showing hyperpolarization, rebound burst firing, and LTCS (above) due to hyperpolarizing current injection (below) in the same neuron from a sham group. D In neurons from sham and GA treated animals, analysis of rebound burst action potentials across steps of hyperpolarization shows no difference across current injections (sham n=19 cells from 8 animals, GA n= 17 cells from 8 animals; F(2,38) = .093, p=.911). E Bar graph of −200 pA current injection to illustrate variability and spread of LTCS action potential number F Analysis of latency to rebound action potential likewise showed no difference between sham and GA groups (p>.05 at all current injections). G Resting membrane potential is not altered between experimental (GA) and control (sham) groups (t(26)=0.574, p=.571). H Input resistance is similar between sham and GA groups (p>.05 for all current injections).

