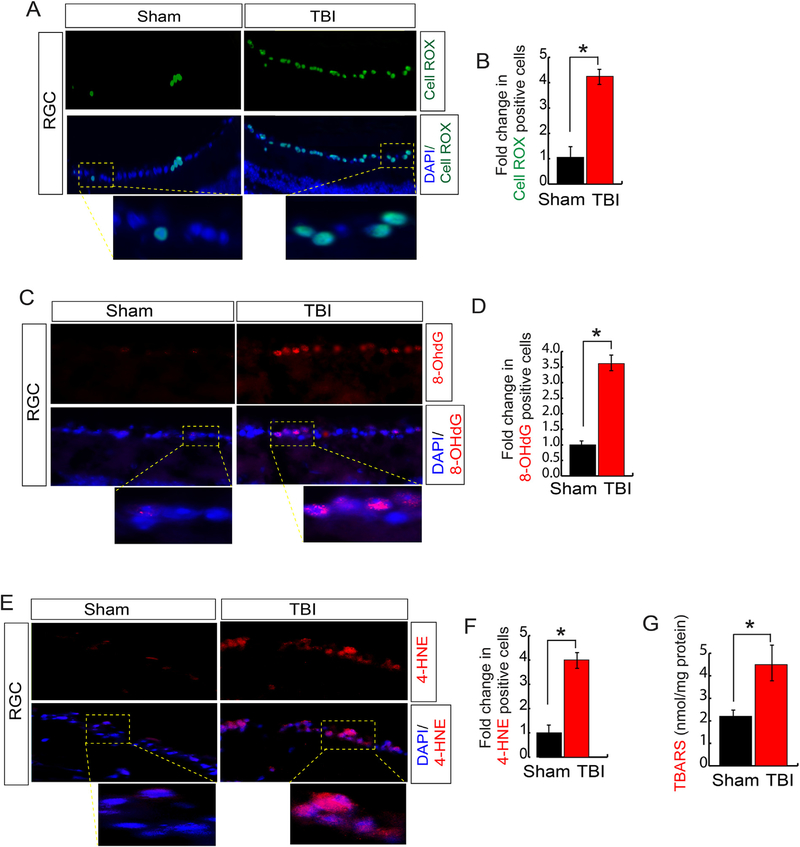
Fig. 1. TBI induces oxidative stress in RGC.
(A–B) Confocal microscopic analysis (A) and quantitative analysis (B) shows that CellROX positive cells were increased more than 4-fold significantly in RGC following TBI. (C–D) Confocal microscopic analysis (C) and quantitative analysis (D) show that the 8-OhDG (a marker for oxidatively modified DNA) positive cells were increased more than 3-fold significantly in RGC following TBI. (E–F) Confocal microscopic analysis (E) and quantitative analysis (F) show that 4-HNE (lipid peroxidation marker) positive cells were increased more than 3-fold significantly in RGC following TBI. (G) The TBARS analysis suggests that TBI leads to an increase in lipid peroxidation significantly. Statistical significance was measured by one-way ANOVA with a Tukey-Kramer post-hoc correction, n = 5, *p < 0.05. All data are expressed as mean ± S.E.M.

