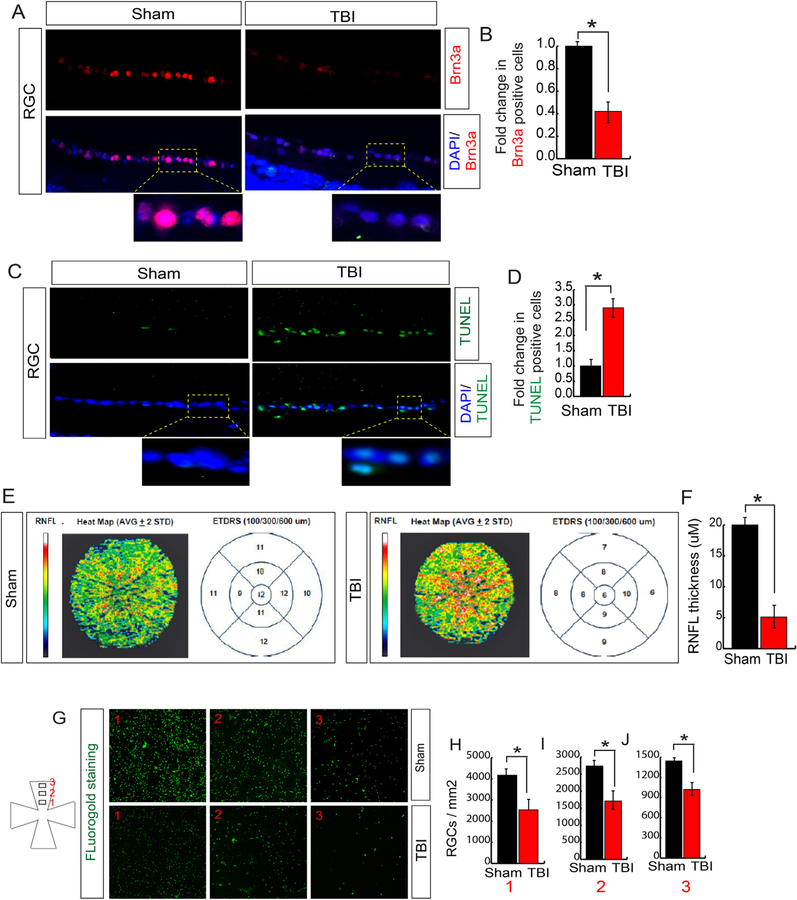
Fig. 2. TBI induces cell death in RGC.
(A–B) Confocal microscopic data (A) and quantitative analysis (B) shows that the number of Brn3a positive cells was decreased in RGC following TBI. (C–D) Confocal microscopic data (C) and quantitative analysis (D) show that the number of TUNEL positive cells (green fluorescence) was increased in RGC following TBI. (E–F) The SD-OCT data shows that the RNFL thickness has been decreased in ETDRS measured after 100, 300 and 600 μM diameter. (F) The quantitative analysis of RNFL thickness measured by SD-OCT in both TBI and sham mice. (G–H) FG staining shows that TBI leads to a decrease FG in RGC compared to sham mice. Box 1, 2 and 3 are 0.5 mm, 1 mm and 1.5 mm from the center. Statistical significance was measured by one-way ANOVA with a Tukey-Kramer post-hoc correction, n = 5, *p < 0.05. All data are expressed as mean ± S.E.M. (For interpretation of the references to color in this figure legend, the reader is referred to the Web version of this article.)

