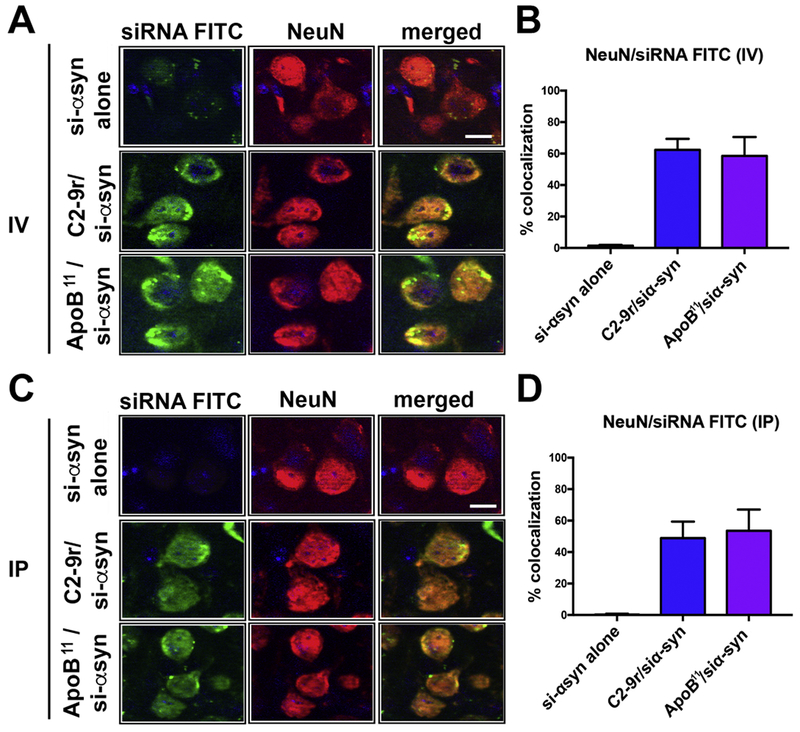
Figure 3. Comparison of the levels of the peptide-siRNA α-syn in the mouse brain following intra-venous or intra-peritoneal delivery.

Non-tg mice received a single intravenous (IV) or intra-peritoneal (IP) injection of FITC labeled α-syn siRNA (si-αsyn) conjugated to either C2-9r, ApoB11 or naked siRNA (si-αsyn alone), 4 hours after injection, mice were sacrificed, whole brain removed, fixed and sections immunolabeled with an antibody against the neuronal marker NeuN (red). (A) Representative images from the frontal cortex following IV injection of FITC tagged si-αsyn alone or conjugated to C2-9r or ApoB11 in sections immunolabeled with NeuN and analyzed with the laser scanning confocal microscope. (B) Image analysis of the sections to estimate the co-localization with between the FITC labeled siRNA (green) and NeuN (red) expressed as % showing very little or no trafficking with the naked siRNA while comparable levels of penetration into neurons in vivo with the C2-9r, ApoB11 peptides. (C) Representative images from the frontal cortex following IP injection of FITC tagged si-αsyn. (D) Image analysis of the % co-localization between the FITC labeled siRNA (green) and NeuN (red) showing no trafficking of the naked siRNA while high levels of penetration into neurons in vivo with the C2-9r, ApoB11 peptides. n=3 non-tg (4m/o) mice per group. Scale bar represents 10 μm.
