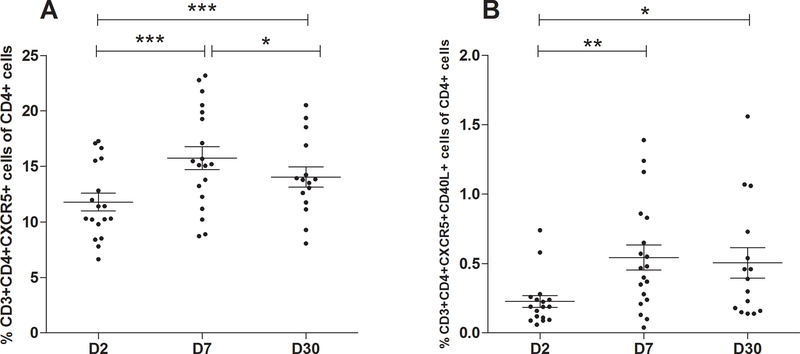
FIG. 1. Frequency of Tfh cells and CD40L expressing Tfh cells after onset of cholera.
(A) Frequency of Tfh cells (CD3+CD4+CXCR5+) and (B) frequency of CD40L-expressing Tfh cells (CD3+CD4+CXCR5+CD40L+) plotted as a percentage of total CD4+ cells in peripheral blood at day 2 (D2), day 7 (D7) and day 30 (D30) following onset of cholera (n=20). Data are presented as the mean percentage of Tfh cells and the CD40L+ Tfh cells, with error bars representing standard error of the mean. An asterisk represents a significant increase from day 2 or decrease from day 7 (* <0.05, **<0.01, ***<0.001) using a paired t-test.

