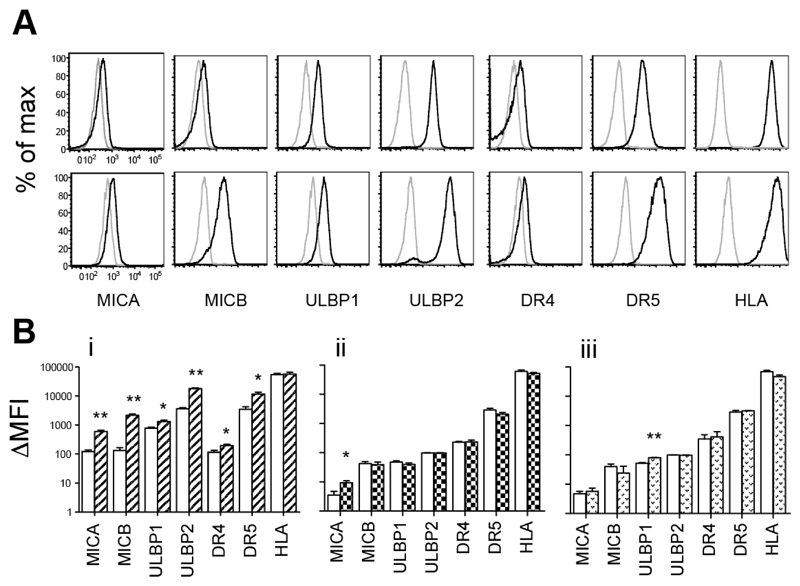
Figure 1. Induction of NK Ligands on NALM-6.
(A) MICA, MICB, ULBP1, ULBP2, DR4, DR5 and HLA expression was assessed on NALM-6 treated with vehicle control (upper) and with Bortezomib (lower) by flow cytometry. Live cells were gated for analysis based on forward and side scatter parameters. Histograms show fluorescence of unstained cells (grey line) compared with fluorescence of cells stained with specific antibody (black line). Representative data from one of 3 experiments is shown. (B) ΔMFI (mean fluorescence intensity in stained minus mean fluorescence intensity in unstained) showing mean +/- SD from 3 independent experiments with i) Bortezomib ii) Valporate and iii) Troglitazone treated NALM-6. (*p<0.05, **p<0.01 when comparing expression of each ligand in vehicle and drug-treated cells).

