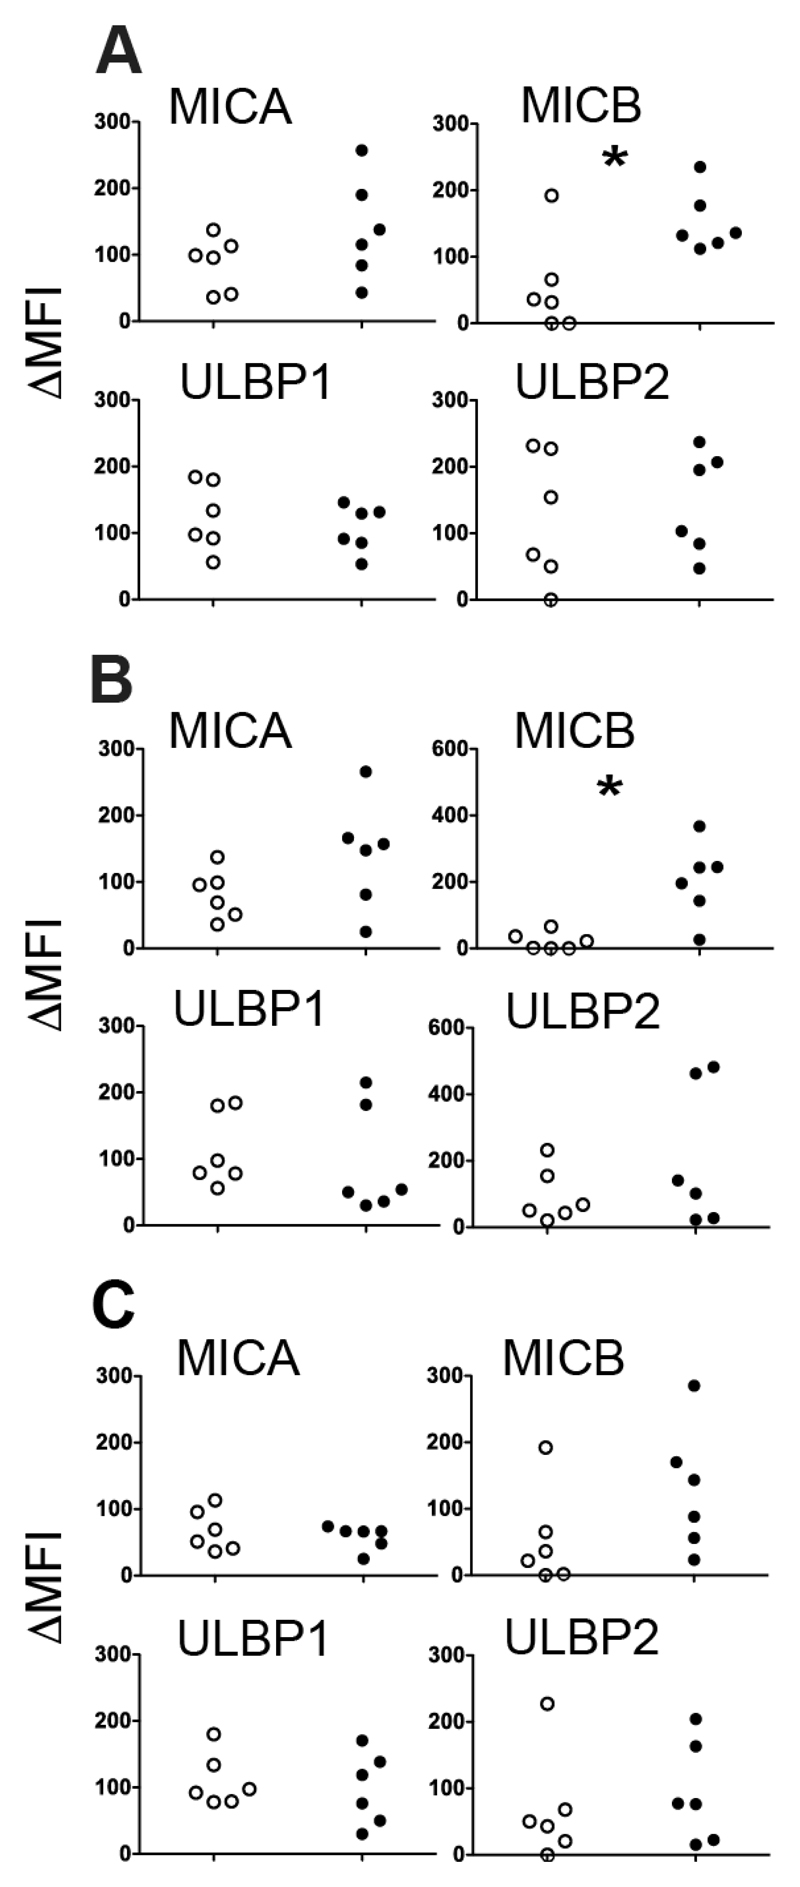
Figure 3. Induction of NK Ligand Expression on Primary ALL Blasts.
(A-C) Scatter plots showing effect of drug treatment on NKG2D ligand expression (ΔMFI above isotype control) for each of 3 primary ALL samples treated in duplicate with: A) 50nM Bortezomib, B) 1mM Valproate and C) 5μM Troglitazone compared with vehicle controls. Ligands MICA, MICB, ULBP1 and ULBP2 as indicated (*p<0.05, **p<0.01).

