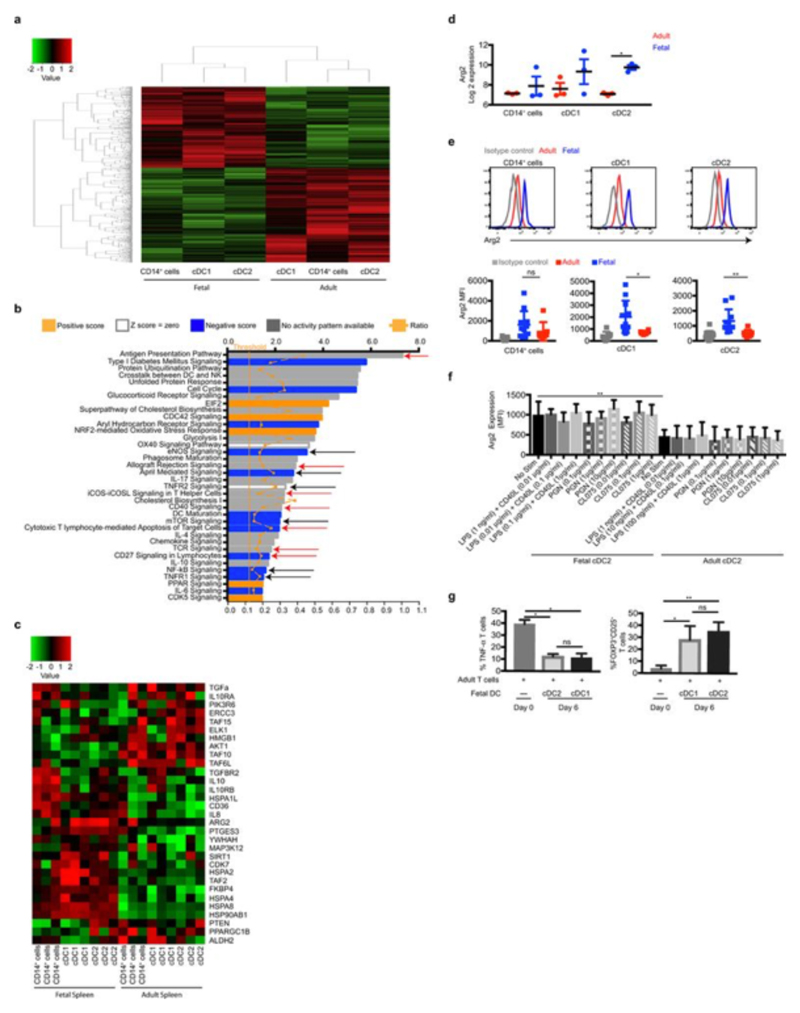
Extended Data Fig. 9. Gene expression comparison between fetal and adult APC.
a, Heatmap showing the row-based z-score normalized gene expression intensities of 3,909 differentially expressed genes between fetal and adult APC. DEGs were identified using t-test with BH multiple testing corrected p-value of <0.05. The genes and cell populations were clustered using Pearson correlation distance measure and Complete Linkage method. b, Ingenuity™ Pathway Analysis (IPA) of the differentially-expressed genes (DEGs), >1.5 fold change, between fetal and adult APC. The bars indicate the p values (-log10) for pathway enrichment. The yellow squares indicate the ratio of the number of up- or down-regulated genes mapped to the enriched pathway, to the total number of molecules on that pathway represented by the dashed yellow line. The horizontal solid yellow line corresponds to the >1.5 fold change threshold. Red arrows highlight pathways involved in DC:T cell interactions, black arrows highlight pathways associated with iNOS/TNF-α signaling. c, Heatmap of immune-modulatory genes involved in cellular metabolism, immune suppression and the iNOS/TNF-α signaling. Heat map shows the row-based z-score normalized gene expression intensities. d, e Microarray (d) and flow cytometry (e) data demonstrating arginase-2 expression by fetal (blue, n=11) and adult (red, n=7) APC subsets. Isotype control, grey histogram and square on scatterplot (n=7). Mean frequencies ± s.e.m. f, Fetal and adult cDC2 arginase 2 expression is not mediated by TLR stimulation. Fetal liver and adult spleen cDC2 were sort-purified and stimulated with the indicated TLR agonists or DMSO control for 18hrs. cDC2 arginase 2 (Arg 2) expression was measured by flow cytometry. Mean frequencies ± s.e.m. One-way Anova, multiple comparisons test. ** P<0.01

