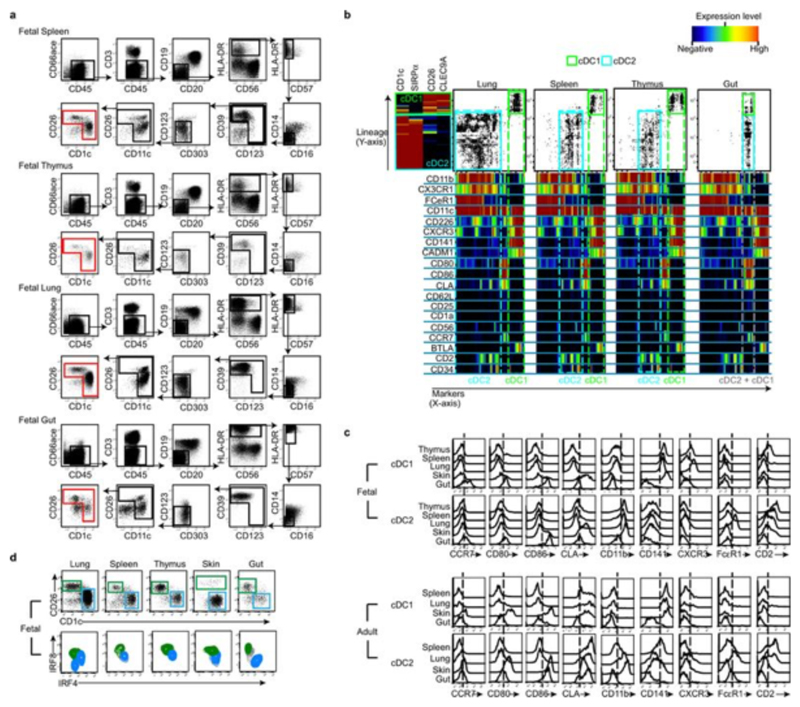
Extended Data Fig. 5. Phenotypic characterisation of fetal spleen, thymus, lung and gut cDC.
a, Representative gating strategy used to select input population (red gate) for One-Sense analysis from fetal spleen, thymus, lung and gut (17wk EGA). b, Characterization of cDC1 (green gate) and cDC2 (cyan gate) across fetal lung, spleen, thymus and gut using CyTOF and one-Sense algorithm11. The lineage dimension included CD1c and SIRPα as cDC2 markers, CD26 and CLEC9A as cDC1 markers. The marker dimension includes all the other non-lineage markers of the CyTOF panel. Frequency heat maps of markers expression are displayed for both dimensions. The expression of markers by fetal cDC1 (green) and cDC2 (cyan) subsets are highlighted with the dashed gates. Representative data from n=5 experiments. c, Histograms displaying surface markers differentially expressed across fetal organs (17 wk EGA) but conserved from fetus to adult. The histograms are generated from CyTOF data (generated as described above). Data is representative of n=5 experiments. d, Fetal cDC1 (green gate) and cDC2 (blue gate) populations were identified within each organ based on their CD26 and CD1c expression (top panel) by flow cytometry analysis. Using the gates in the top panel to select fetal cDC1 (green contours) and cDC2 (blue contours), intracellular expression of IRF8 and IRF4 was determined by flow cytometry. Representative data. n=3.

