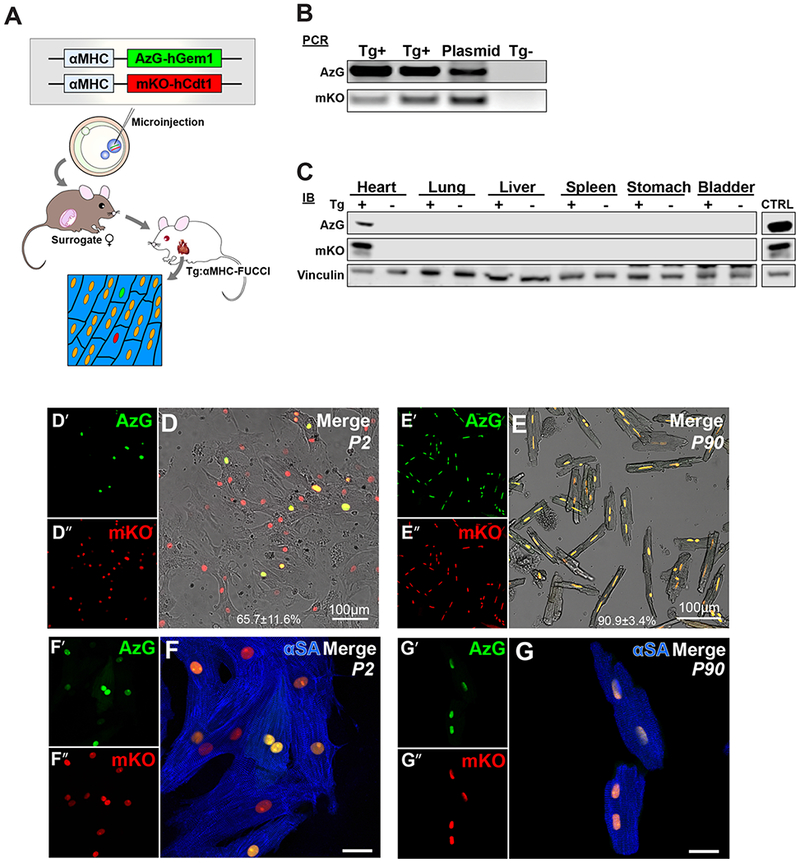
Fig. 2. FUCCI-Tg expression is specific to cardiomyocytes.

(A) Schematic of transgenic mouse production, n=250 embryos injected, n=28 pups screened for transgene integration, n=1 founder line established. (B) PCR analysis confirm transgene integration in genomic DNA. (C) Immunoblot analysis of founder organs demonstrate cardiac specificity of transgenes. (D-E) Representative images of isolated P2 (D) and P90 (E) mouse cardiomyocytes express FUCCI fluorescence of AzG (green, D’, E’), mKO (red, D”, E”), scale bar 100μm. (F-G) Representative images of nuclear AzG (green) and mKO (red) native fluorescence visualized in α-sarcomeric actinin (αSA, blue) positive P2 (F) and P90 (G) isolated cardiomyocytes, respectively. Scale bar 20μm
