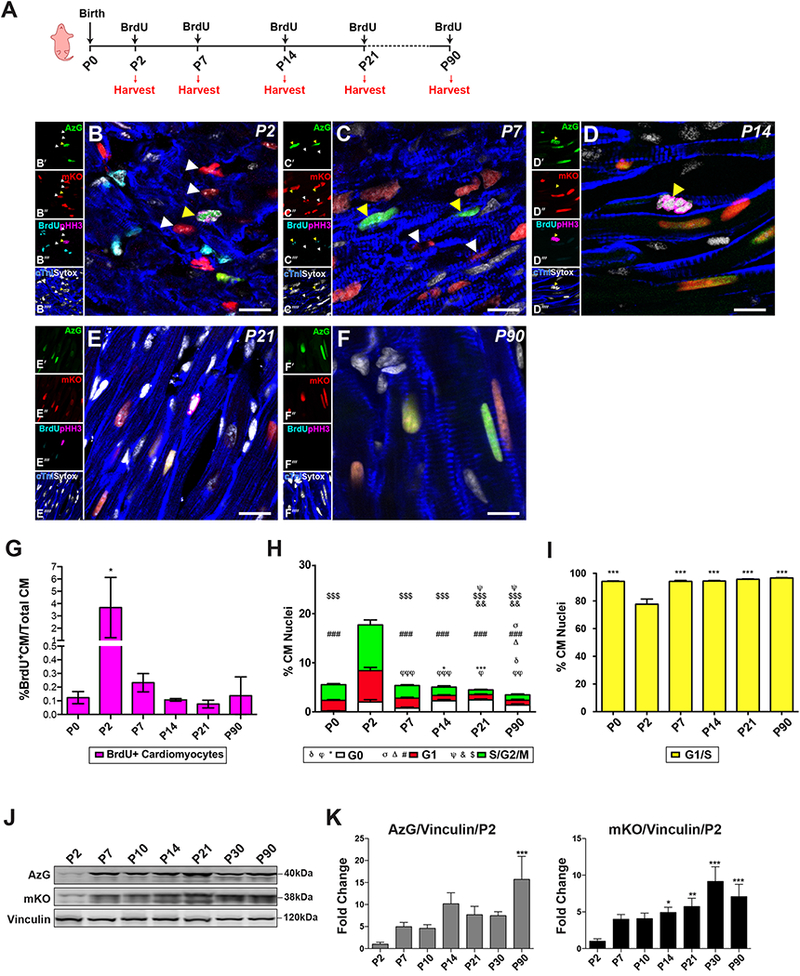
Fig. 3. Postnatal cardiomyocyte cell cycle progression transitions toward arrest at G1/S within days after birth.

(A) Schematic of developmental time-point isolation, single BrdU injection (150mg/kg) given 2 hours prior to harvest. (B-F) Merged representative confocal images showing AzG and mKO expression in cardiomyocytes during postnatal development visualized by immunostaining and confocal microscopy in cardiac tissue sections at P2 (B), P7 (C), P14 (D), P21 (E), and P90 (F); AzG (green, B’-F’), mKO (red, B”-F”), pHH3 (magenta, B”‘-F”‘), BrdU (cyan, B”‘-F”‘), Sytox (white, B”“-F”“) and cardiac Troponin I (blue, B”“-F”“), Scale bar 10μm, n=3–5 hearts per time point. (G) Quantification of percent of BrdU+ cardiomyocytes in all cardiomyocytes counted peaks at P2 and decreases thereafter, * P <0.05 vs. P0. (H) Quantification of percent of cardiomyocyte nuclei in different cell cycle phases shows G0(mKO−/AzG−), G1(mKO+) and S/G2/M (AzG+). G0: φP<0.05, φφP<0.001, φφφP<0.0001 vs. P0; *P<0.05, ***P<0.001 vs. P7, δP<0.05 vs. P21. G1: σP<0.05 vs. P7, ΔP<0.05 vs. P0. ### P<0.0001 vs. P2. S/G2/M: ψP<0.05 vs. P7, &P<0.001 vs. P0, $$$ P<0.0001 vs. P2. (I) Quantification of percent of cardiomyocyte nuclei in G1/S transition of the cell cycle, ***P<0.0001 vs. P2. (J) Representative immunoblot of whole heart lysates indicate AzG/mKOA/Vinculin protein expression from P2 to P90 show increased protein expression with age. (K) Quantitation of AzG (left) and mKO (right) protein expression relative to loading Vinculin vs P2. *P<0.05, **P<0.001, ***P<0.0001 vs P2. n = 4055 (P0), 1953 (P2), 7536 (P7), 2861 (P14), 4765 (P21), 1873 (P90) CM nuclei from 6 hearts per time point. One-way ANOVA, Tukey’s post hoc test.
