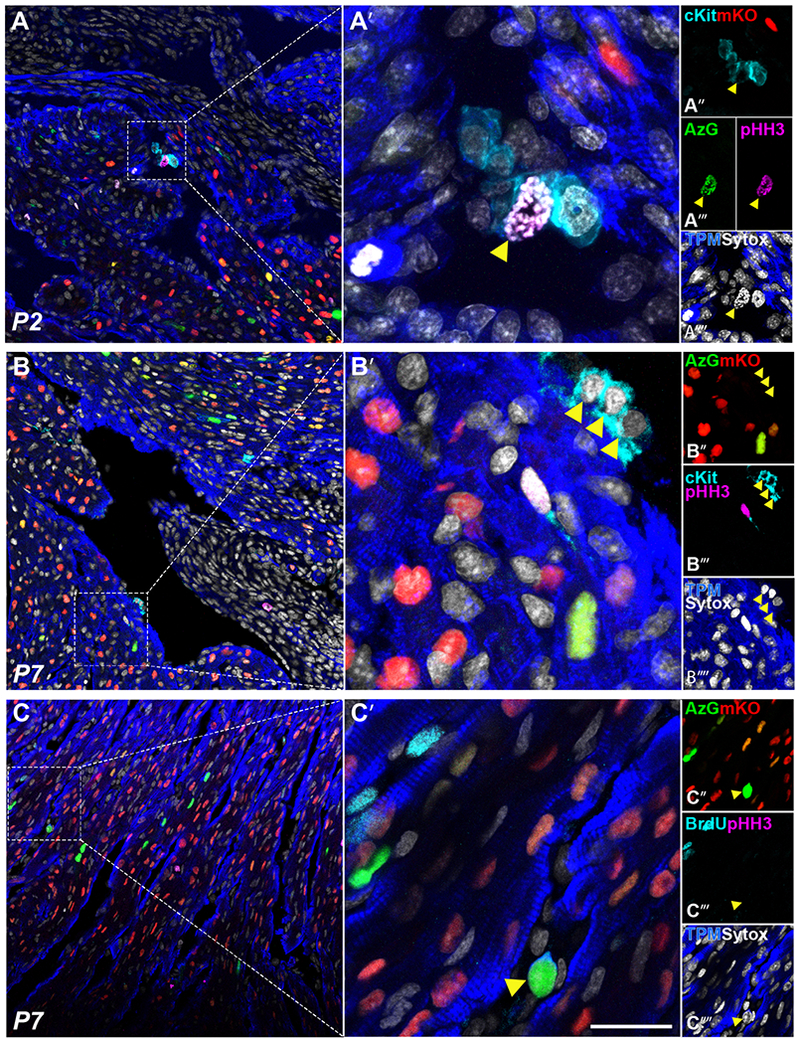
Fig. 5. Amplifying progenitors express AzG in vivo.

Representative confocal images of early postnatal development tissue sections P2 (A) and P7 (B, C) respectively, showing native fluorescence of AzG (green, A’”, B”), mKO (red, A”-C”), and immunolabeling for cKit (cyan, A”, B’”, C’”), pHH3 (magenta, A”‘-C”‘), sytox (white, A”“-C”“) and tropomyosin (blue, A”“-C”“), scale bar 50μm in A, B, C; 10μm in A’-C’. Yellow arrow shows cKit+/AzG+/pHH3+ amplifying cardiac progenitor in P2 cardiac sections (A), and AzG+/cTnl+ immature cardiomyocyte in P7 section (C).
