Fig. 1.
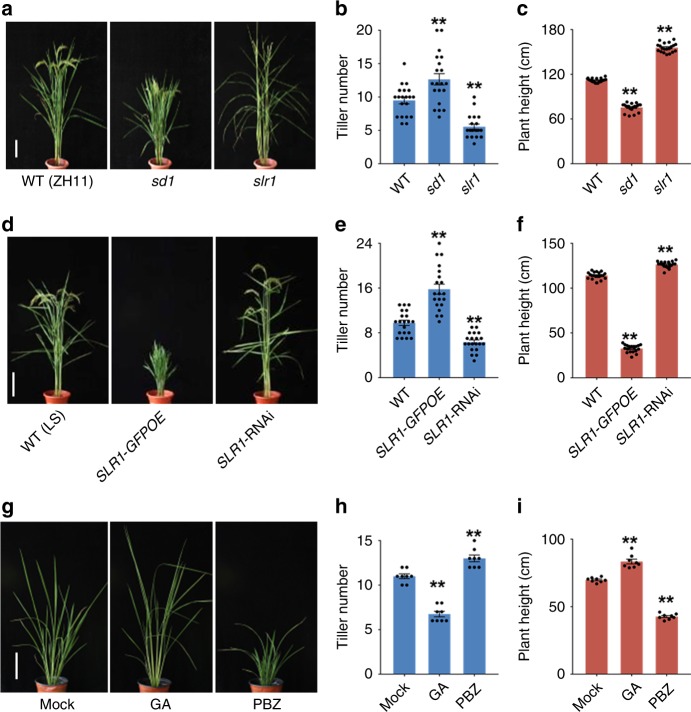
Tiller number and plant height are coordinated inversely by GA. a Appearance of the wild-type (WT, ZH11) and GA-signaling mutants at the heading stage. Scale bar, 20 cm. b, c Tiller number (b) and height (c) of plants shown in (a). d Appearance of SLR1-transgenic plants at the heading stage. Scale bar, 20 cm. e, f Tiller number (e) and height (f) of plants shown in (d). g Appearance of WT plants after GA and PBZ treatments for 1 month. Scale bar, 20 cm. h, i Tiller number (h) and height (i) of plants shown in (g). Asterisks indicate significant difference to the WT or mock (two-tailed Student’s t test, **p < 0.01; mean ± s.e.m., n = 20 in (b, c, e, f), and 8 in (h) and (i). Source data are provided as a Source Data file

