Fig. 2.
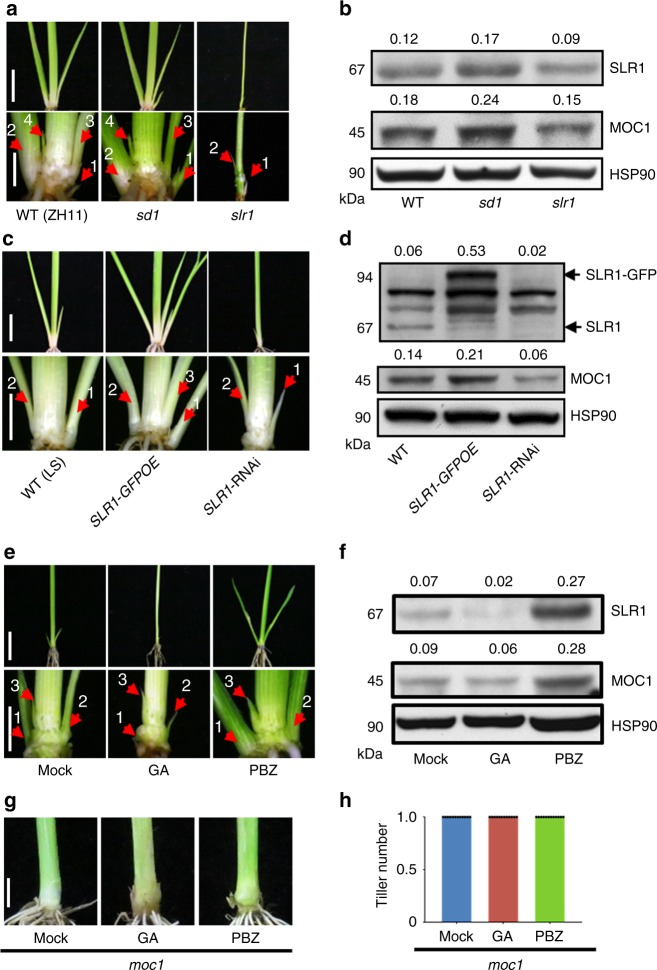
GA signaling inhibits tiller bud outgrowth and the protein level of MOC1. a Shoot bases of the WT (ZH11), sd1, and slr1 seedlings at 30 DAG. The bottom row shows magnified images. The arrows indicate axillary buds or tillers. Scale bar, 2 cm (top) and 0.5 cm (bottom). b Protein levels of SLR1 and MOC1 in WT, sd1, and slr1, determined by protein blotting. Heat-shock protein 90 (HSP90), loading control. Values above panels indicate signal strength for SLR1 and MOC1 in arbitrary units determined by densitometry. c Shoot bases of WT (LS), SLR1-GFPOE, and SLR1-RNAi seedlings at 30 DAG. The bottom row shows the magnified images. Arrows indicate axillary buds or tillers. Scale bar, 2 cm (top) and 0.5 cm (bottom). d Protein blotting shows protein levels of SLR1 and MOC1 in WT (LS), SLR1-GFPOE, and SLR1-RNAi transgenic plants. HSP90, loading control. Values above panels indicate as in (b). e Effects of GA and PBZ treatments on tiller bud outgrowth. The bottom row shows the magnified images. Arrows indicate axillary buds or tillers. Scale bar, 2 cm (top) and 0.5 cm (bottom). f Effects of GA and PBZ treatments on SLR1 and MOC1 protein levels, determined by protein blotting. HSP90, loading control. Values above panels indicate as in (b). g Effects of GA and PBZ treatments on the tiller number of moc1. Scale bar, 0.5 cm. h Quantification of the tiller number shown in (g) (n = 12). The full scans of immunoblots are shown in Supplementary Fig. 12. Source data are provided as a Source Data file

