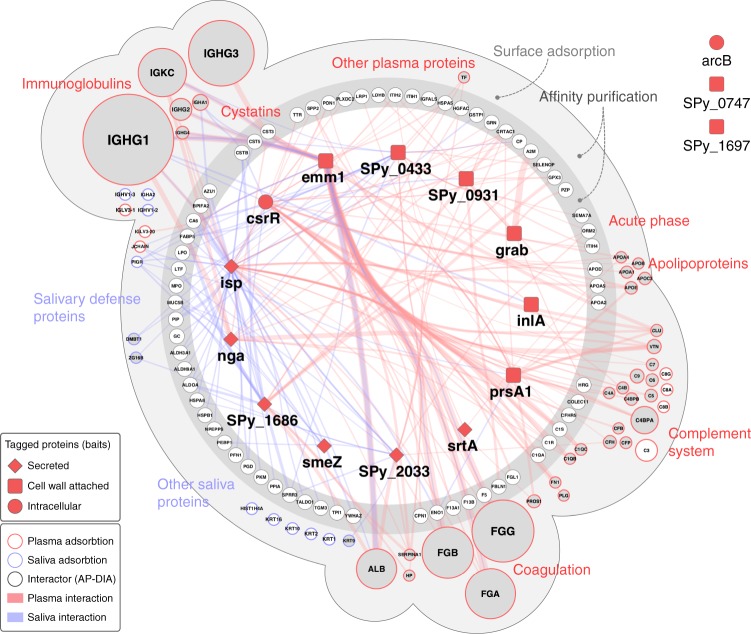
Fig. 2.
A combined network layout of the AP–DIA and SA–DIA interaction maps. Overlap of the AP–DIA and SA–DIA plasma and saliva interactomes. Streptococcal bait proteins are presented as dark red squares (cell wall-attached proteins), diamond shapes (secreted proteins) or spheres (intracellular proteins). The AP–DIA interactome is represented as the inner dark gray circle according to functional protein class, with the protein interactions indicated in red for human plasma and blue for saliva. The thickness of the edges connecting the nodes indicates the abundance of the captured human proteins in relation to the respective bait proteins. Proteins identified both in the AP–DIA and SA–DIA approaches are enclosed in the outer light gray sphere, where the circle sizes represent protein abundance derived from the SA–DIA experiments and the colors (red or blue) indicates predominant plasma or saliva protein interactions. The nodes of these overlapping interaction networks are filled in gray for easier visualization. Proteins exclusively identified in SA–DIA are placed in the outer light gray sphere and are not connected with edges. Streptococcal bait proteins without any identified human interactions are depicted outside the interactome area, being arcB, and the uncharacterized proteins Q9A0J7 (Spy_0747) and Q99YH8 (Spy_1697). The interactome views were generated using Cytoscape69 and modified in Adobe Illustrator. Source data are provided as a Source Data file

