Fig. 7.
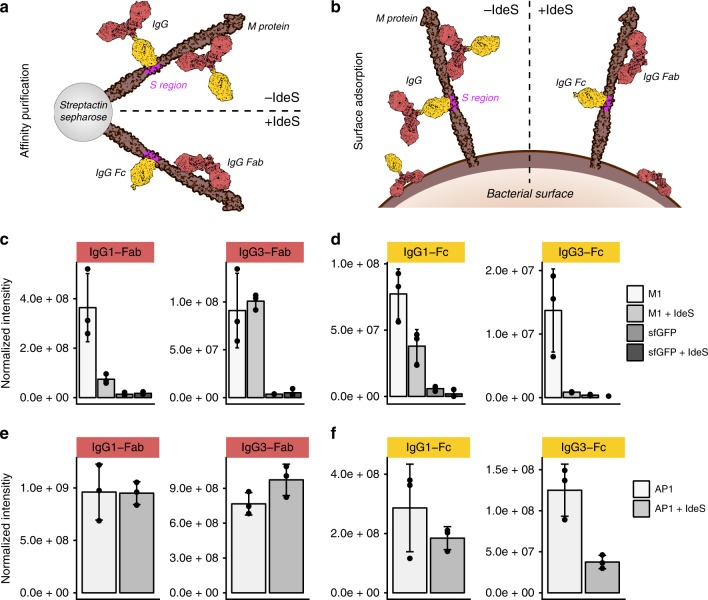
Plasma IdeS pre-treatment in AP–DIA and SA–DIA. a IgG binding in AP–DIA experiments in non-treated plasma and plasma pre-digested with IdeS. b IgG binding in SA–DIA experiments in non-treated plasma and plasma pre-digested with IdeS. c, d Quantification of Fab and Fc-specific signature peptides after IdeS cleavage using targeted MS analysis after affinity purification on the M1 protein. sfGFP was used as a negative control. e, f Quantification of Fab and Fc-specific signature peptides after IdeS cleavage using targeted MS analysis after affinity purification using whole wild-type M1 serotype AP1 bacteria. Error bars are expressed as standard deviation (s.d.) from the mean. All experiments were prepared using n = 3 biologically independent samples. Source data are provided as a Source Data file

