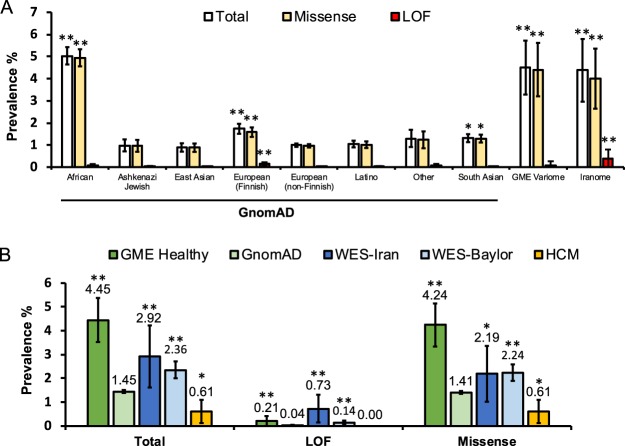
Figure 4.
(A) Bar graph comparing the frequencies of rare JPH2 variants in ostensibly healthy individuals. The gnomAD cohort is broken down into 8 ethnic subgroups. GME Variome and Iranome represent 2 independent Middle Eastern cohorts. No fill, total frequency; tan, missense variant frequency; red, LOF variant frequency. Error bars denote 95% CI; *P < 0.05, **P < 0.001 compared to European (Non-Finnish). (B) Bar graph comparing the frequencies of JPH2 variants in a GME Healthy Cohort (GME Variome + Iranome), an ostensibly healthy population (gnomAD), a cohort of clinical WES referrals at Baylor College of Medicine (WES), a cohort of clinical WES referrals from Iran (WES-Iran), and a population of those diagnosed with HCM. Error bars denote 95% CI; *P < 0.05, **P < 0.001 compared to gnomAD.

