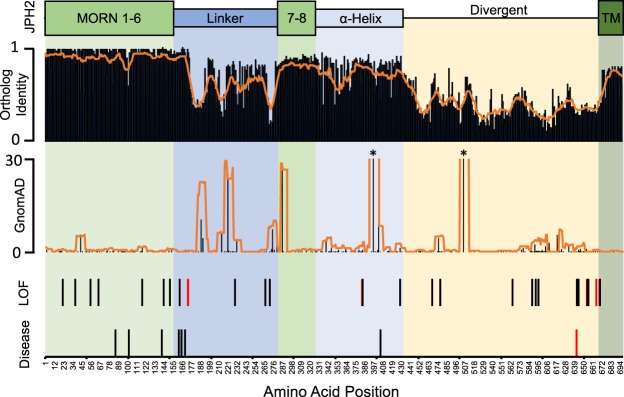
Figure 5.
Amino-acid level genetic variability analysis of JPH2. Functional domains of JPH2 are depicted. Ortholog identity map and prevalence of variants in healthy individuals (gnomAD) by amino acid are depicted with orange lines representing rolling averages. Amino acid positions containing radical variants found in ostensibly healthy individuals and disease-causing variants found in those with cardiomyopathies are depicted, with those in red representing variants identified in individuals from the Middle East. MORN, membrane occupation and recognition nexus domain; TM, Transmembrane domain. *MAF exceeding Y-axis.

