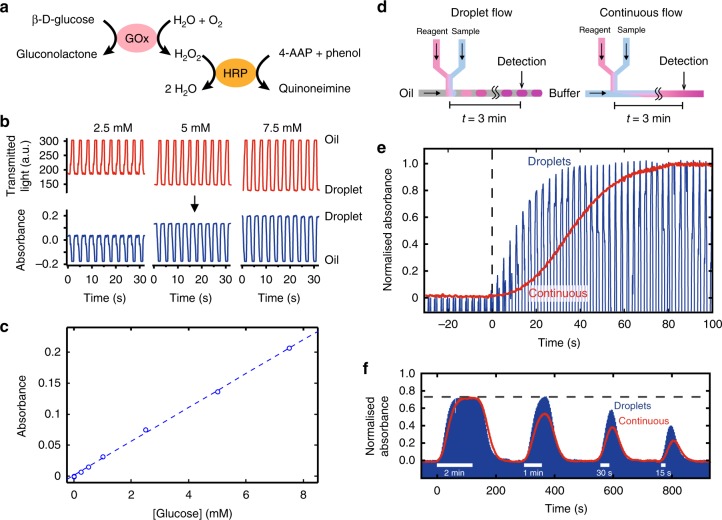
Fig. 3.
Glucose assay and sensor calibration. a The reaction mechanism for the glucose assay. Glucose is broken down by glucose oxidase (GOx) to yield gluconolactone and hydrogen peroxide (H2O2), which is then catalysed by horseradish peroxidase (HRP) in the presence of phenol and 4-aminoantipyrine (4-AAP) to form a red-violet coloured product quinoneimine. b Examples of raw data from the flow cell (top) converted to absorbance (bottom) using a pre-recorded blank measurement of droplets with 0 mM sample. c The measured absorbance was linear with respect to glucose concentration up to 8 mM. d Flow schematic diagram for droplet flow (left) and continuous flow (right) experiments. e Comparison of the sensor’s temporal response to a concentration step change when operating in droplets (blue) and continuous flow (red). In droplet flow, it took 38 s, or 13 droplets, to reach the step plateau whilst the continuous stream took 80 s. f Comparison of dynamic in vitro microdialysis response when operating in droplets (blue) and continuous flow (red). For microdialysis sampling, we imposed concentration change at the probe of varying durations, from 2 min to 30 s, to simulate transient events in tissues. The response is normalised relative to the response obtained when the glucose solution was directly aspirated, bypassing the microdialysis probe. Hence, the dotted line represents the relative recovery of the microdialysis probe

