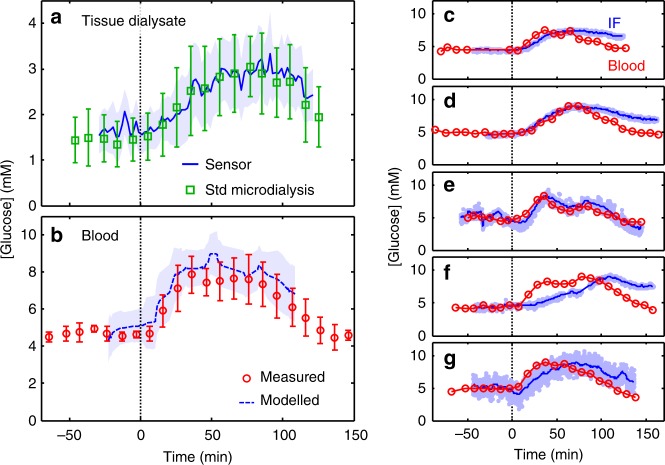
Fig. 4.
In vivo measurement of glucose in subcutaneous interstitial fluid. a Average (n = 5) dialysate glucose measured by the sensor (blue line and shaded area) and standard microdialysis sampling and offline analysis (green squares and error bars). Each is shown as a function of time since oral glucose administration (vertical dashed line, t = 0) and the error bars/area represent the standard deviation from subject-to-subject variation. b Mean (n = 5) venous blood glucose (red circles and error bars) shown as a function of time since oral glucose administration (vertical dashed line, t = 0). The error bars represent the standard deviation from subject-to-subject variation. The blue dashed line indicates the blood glucose predicted from the sensor data calculated using a two-compartment model37,38 (see Methods and Supplementary Fig. 14). The shaded blue area show the standard deviation of the model output, while the dashed blue is a running average (median ± 20 min). c–g Plots showing the blood glucose (red circles) and estimated interstitial fluid glucose (IF, light blue points with blue line showing a rolling average) for each individual

