Fig. 5.
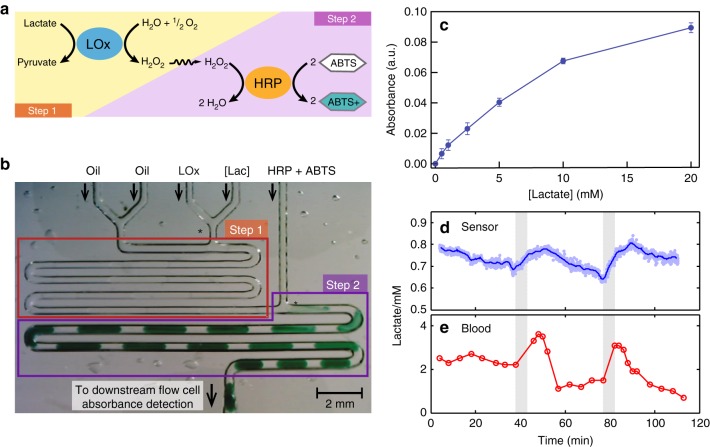
Lactate assay, calibration, and in vivo testing. a Reaction scheme for the lactate assay. Step 1—Lactate is broken down by lactate oxidase (GOx) to yield hydrogen peroxide (H2O2) and pyruvate. Step 2—The H2O2 is then catalysed by horseradish peroxidase (HRP) to oxidise 2,2′-azino-bis(3-ethylbenzothiazoline-6-sulfonic acid) (ABTS) to a blue-green coloured species (ABTS+). b Image of the lactate assay being performed on-chip. The asterisks (*) denote T junctions. Transparent droplets containing lactate samples and LOx at a 1:1 ratio are generated at the T-junction in Step 1. They then travel through the serpentine channel with enough time for the LOx reaction to run to completion. Upon dosing with HRP/ABTS at the second T-junction in Step 2, an intense blue-green colour starts to develop. c The two-step lactate assay (blue circles) gives a monotonic increase to 20 mM, with a near linear response at lower concentrations. Error bars refer to the standard deviation from measurement of multiple droplets. d In vivo sensor measurement of dialysate lactate from subcutaneous interstitial fluid. Each data point represents a measurement from a single droplet with the line indicating the running average. The shaded areas indicate periods of blood occlusion to the tissue. e Blood lactate during the same period

