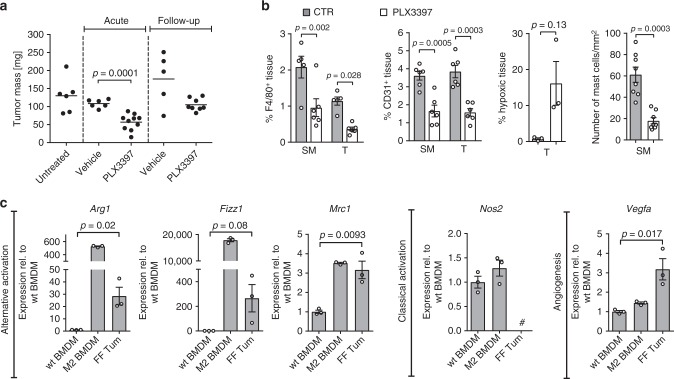
Fig. 5.
Pharmacological macrophage targeting and macrophage polarization in gp130FF tumors. a Total tumor burden in gp130FF mice was quantified either acutely after a 4-week-treatment period with PLX3397 (Csf1r/c-Kit/Flt3 tyrosine kinase receptor inhibitor) or vehicle or after a 4 weeks treatment-free follow-up period. Each symbol represents an individual mouse. Data from three independent experiments are presented. t-test t (df) = 5.23 (14). b Quantification of F4/80, CD31, Hypoxyprobe or toluidine-blue-stained sections of submucosa (SM) or gastric tumors (T) of gp130FF mice of the indicated acute treatment cohort. F4/80: n = 5 (Vehicles) and n = 6 (PLX3397), one-way ANOVA F (DFn, Dfd) = 12.34 (3, 18); CD31: n = 6, one-way ANOVA F (DFn, Dfd) = 18.33 (3,20); hypoxic tissue: n = 3, t-test with Welch’s correction t (df) = 2.53 (2); mast cells: n = 8 (both groups), and t-test with Welch’s correction t (df) = 5.59 (9.27). c qPCR expression analysis of genes associated with alternative activation (Arg1, Fizz1, Mrc1), classical activated (Nos2) and angiogenesis (Vegfa) of purified F4/80+ tumor-associated macrophages (FF Tum) or following stimulation of bone marrow-derived macrophages (BMDM) from wild-type mice and stimulated either with vehicle (wt BMDM) or with IL-4/IL-13 (20 ng/ml) to induce an alternative activated endotype (M2 BMDM). n = 3 mice. Hash indicates that expression was below detection limit. Arg1: t-test t (df) = 3.8 (4); Fizz1: t-test t (df) = 2.39 (4); Mrc1: t-test t (df) = 4.69 (4); Vegfa: t-test t (df) = 3.96 (4). Data are represented as mean ± SEM, with p values p < 0.05 considered being significant. Source data are provided as a Source Data file. See also related Supplementary Fig. 4

