Fig. 6.
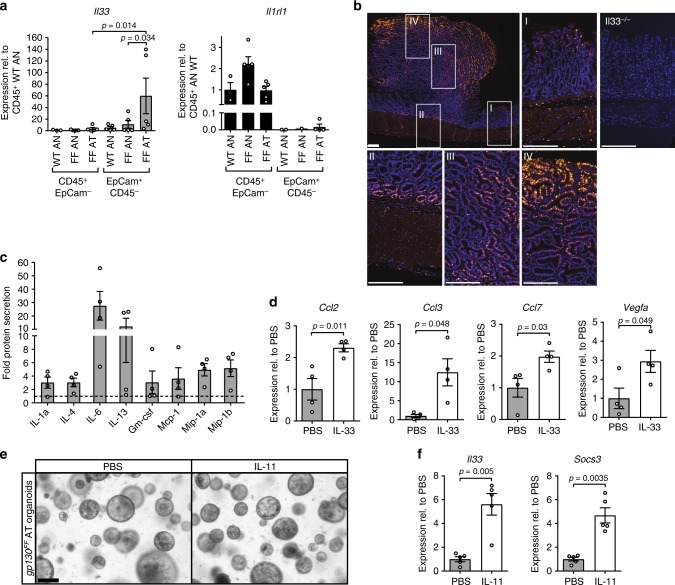
IL-33 expression in gastric tumors of gp130FF mice and mast cell activation analysis. a qPCR expression analysis of Il33 and full-length St2 (Il1rl1) genes associated with hematopoietic (CD45+; EpCam−) and epithelial (EpCam+; CD45−) cells purified from unaffected antrum (AN) or antrum tumors (AT) from wild-type and gp130FF (FF) mice. Data are normalized to Gapdh and plotted as relative expression to CD45+; EpCAM− WT AN expression. n = 5 mice. Il1rl1 expression in EpCam+; CD45− cells was for several samples below detection limit. Data was pooled from two independent experiments. For IL33 data, one-way ANOVA was performed with F (DFn, Dfd) = 2.871(5, 22); b Immunofluorescence staining for IL-33 in stomachs of tumor-bearing gp130FF mice with insets referring to unaffected antrum (I), submucosal-tumor junction (II), tumor core (III), and tumor edge (IV). Stomachs from Il33−/− mice were used for specificity controls. Scale bars = 200 µm. c Multiplex cytokine analysis of supernatant of FACS-purified tumor-associated mast cells stimulated with IL-33 (30 ng/ml) for 3 h. Data are shown only for factors with > 3 fold increase relative to unstimulated control cultures. n = 4 from four independent experiments. d qPCR gene expression analysis in FACS-purified tumor-associated mast cells stimulated with IL-33 (30 ng/ml) for 3 h or vehicle. n = 4 from four independent experiments. Ccl2: t-test t (df) = 3.61 (6); Ccl3: t-test t (df) = 3.2 (3.09); Ccl7: t-test t (df) = 2.84 (6); Vegfa: t-test t (df) = 2.45 (6). e Representative images of organoids derived from antral tumors (AT) of gp130FF mice stimulated either with PBS or IL-11 (100 ng/ml for 2 days). Scale bar = 200 µm. f Il33 gene expression analysis of gp130FF tumor-derived epithelial organoids either stimulated with IL-11 (100 ng/ml) or with PBS for 4 h. For comparison expression of Stat3-target gene, Socs3, was also analyzed. n = 5 from two independent experiments. Stat3: t-test t (df) = 4.96 (4.42); Socs3: t-test t (df) = 5.6 (4.48). Data are represented as mean ± SEM, with p values p < 0.05 considered being significant. Source data are provided as a Source Data file. See also related Supplementary Fig. 5

