Fig. 4.
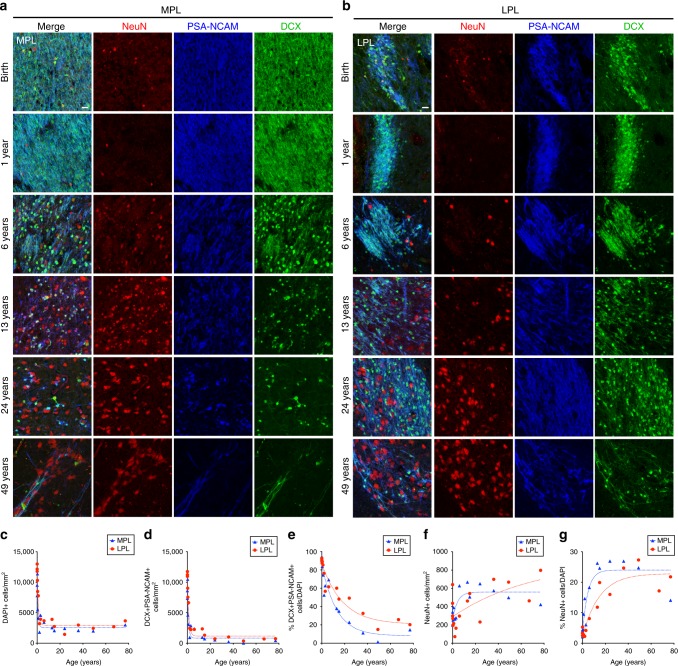
DCX+PSA-NCAM+ neurons decrease and NeuN+ neurons increase in the PL across life. a, b DCX+PSA-NCAM+ cells and NeuN+ cells in the MPL (a) and LPL (b) from birth to 24 years of age. c–g Quantification of cells in the MPL and LPL across life. Each data point corresponds to one individual; line indicates non-linear exponential fit. c Density of DAPI+ nuclei in the PL from birth to 77 years. d Density of DCX+PSA-NCAM+DAPI+ cells in the PL from birth to 77 years. e Percentage of DCX+PSA-NCAM+DAPI+ cells in the PL from birth to 77 years. f Density of NeuN+ cells in the PL from birth to 67 years. g Percentage of NeuN+ DAPI+ cells in the PL from birth to 67 years. Scale bars: 20 µm (a, b)

