Fig. 4.
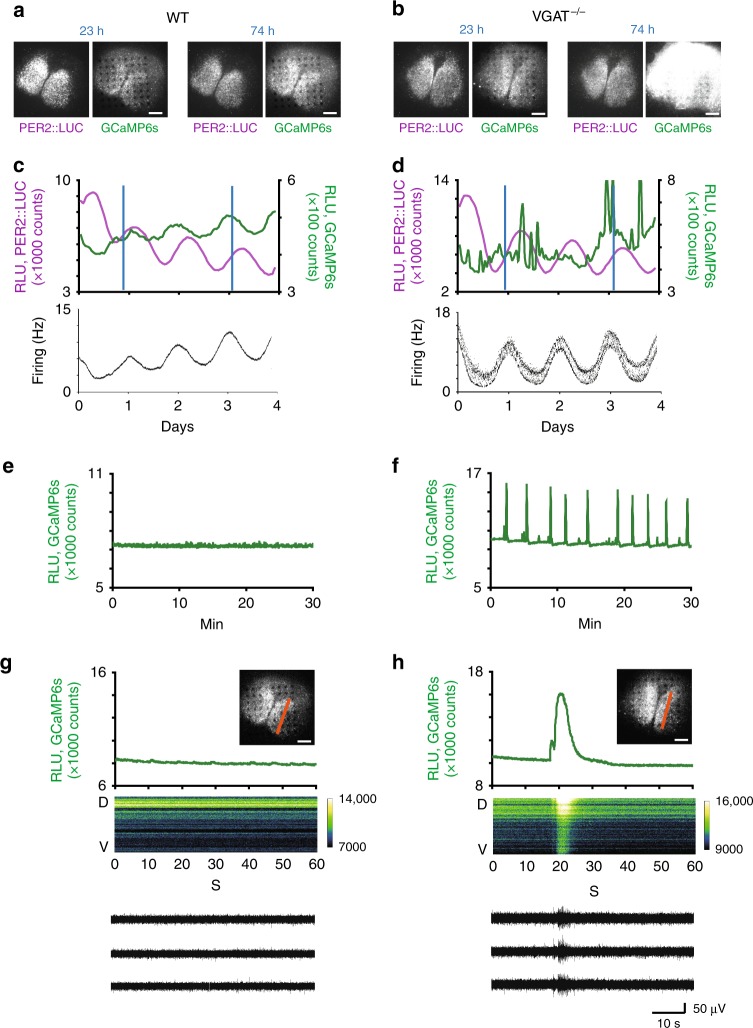
Intracellular Ca2+ monitored simultaneously with PER2::LUC bioluminescence and spontaneous firing in the fetal SCN slice on MED. a, b Intracellular Ca2+ levels and PER2::LUC bioluminescence measured every 1 h from a WT (a) and VGAT−/− (b) SCN slice on MED. Measurements were taken at 23 h (left) and 74 h (right) after the start of culture. Black spots in the SCN slice indicate electrodes. c, d Spontaneous firing was measured every 1 min. PER2::LUC and calcium rhythms were measured at every 1 h and at 3 s, respectively. The VGAT−/− (d) but not the WT (c) SCN exhibited calcium spikes. e, f Fluctuation of intracellular Ca2+ at 0.33 fps for 30 min. g, h Ca2+ level fluctuation at 10 fps for 60 s with an inserted fluorescence image of an SCN superimposed by a red line (upper), a raster plot of Ca2+ fluctuations scanned along the orange line from dorsal to ventral (middle) and spontaneous firings at three electrodes (lower). Ca2+ levels are expressed in pseudocolor, the color key of which is shown at the right margin. Calcium spikes were synchronous throughout the entire SCN slice and coincided in time with burst firings in VGAT−/− SCN

