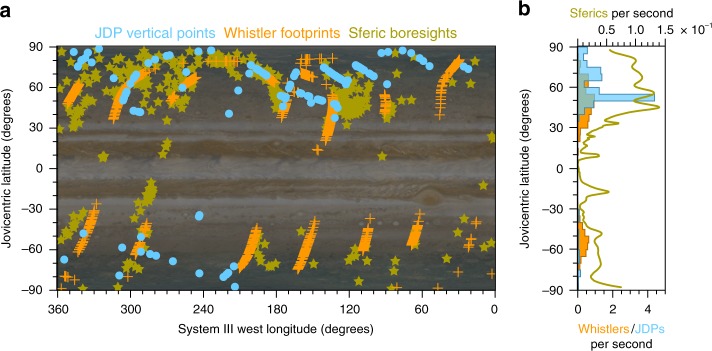
Fig. 3.
Jovian global map of JDPs, lightning-induced whistlers and sferics. a The blue circles depict the vertical projection of Juno when JDPs were captured. The orange plus marks indicate the whistler footprints that were mapped along the JRM09 magnetic field lines19 onto the Jovian atmosphere at altitude of 300 km above the 1-bar level. The yellow stars are the MWR boresights at the 1-bar level for the detections of sferics at 600 MHz. These data were taken from the Juno Waves whistler catalogue3 and the Juno MWR sferic catalogue5 from perijoves 1 through 8. Note that the region between 200° and 280° where JDPs present were sampled from the Juno perijove 9 orbit where sferic and whistler observations have not been completed. The Jovian image was provided by NASA/JPL-Caltech/SSI/SwRI/MSSS/ASI/INAF/JIRAM/Björn Jónsson (http://www.planetary.org/multimedia/space-images/jupiter/merged-cassini-and-juno.html). b Their latitudinal profiles of detection rate are shown using corresponding colours. In addition, the comparison of JDPs with the previous optical detections of lightning is shown in Supplementary Fig. 10

