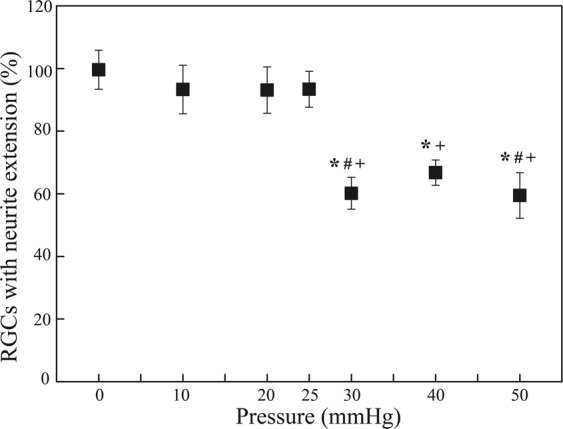
Figure 3.

The proportion of RGCs with neurite extensions (%) 3 days after applying a hydrostatic pressure of 0 mmHg (n = 22 devices, n0,RGCs = 993), 10 mmHg (n = 4 devices, n0,RGCs = 106), 20 mmHg (n = 6 devices, n0,RGCs = 534), 25 mmHg (n = 7 devices, n0,RGCs = 503), 30 mmHg (n = 11 devices, n0,RGCs = 552), 40 mmHg (n = 9 devices, n0,RGCs = 370), and 50 mmHg (n = 11 devices, n0,RGCs = 432 RGCs) for 72 hours. Data are in mean ± SEM. *, # and + indicate statistically different results from 0 mmHg (P < 0.05), 10 mmHg (P < 0.05), and 20 mmHg (P < 0.05) respectively by one-way ANOVA followed by Bonferroni post-hoc test. N0,RGCs represents the number of RGCs with neurite extensions at the baseline.
