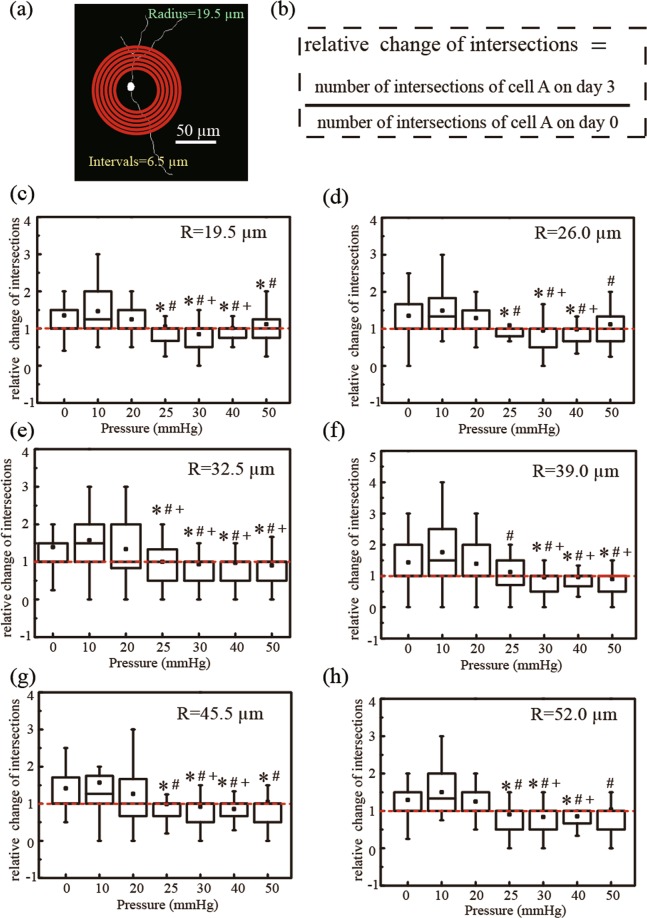
Figure 7.
(a) Sholl analysis of primary RGCs, (c–h) Box chart of the relative number of intersections between neurites and concentric circles(R = 19.5 µm, 26.0 µm, 32.5 µm, 39.0 µm, 45.5 µm and 52.0 µm)after applied hydrostatic pressures of 0 mmHg (n = 155 RGCs), 10 mmHg (n = 67 RGCs), 20 mmHg (n = 109 RGCs), 25 mmHg (n = 77 RGCs), 30 mmHg (n = 76 RGCs), 40 mmHg (n = 80 RGCs), and 50 mmHg (n = 74 RGCs) on day 3. Box plot whiskers indicate the maximum and minimum values of the data. The symbols *, # and + indicate statistical significance relative to 0 mmHg (P < 0.05), 10 mmHg (P < 0.05), and 20 mmHg (P < 0.05), respectively, using One-way ANOVA followed by Bonferroni Post-hoc Test.

