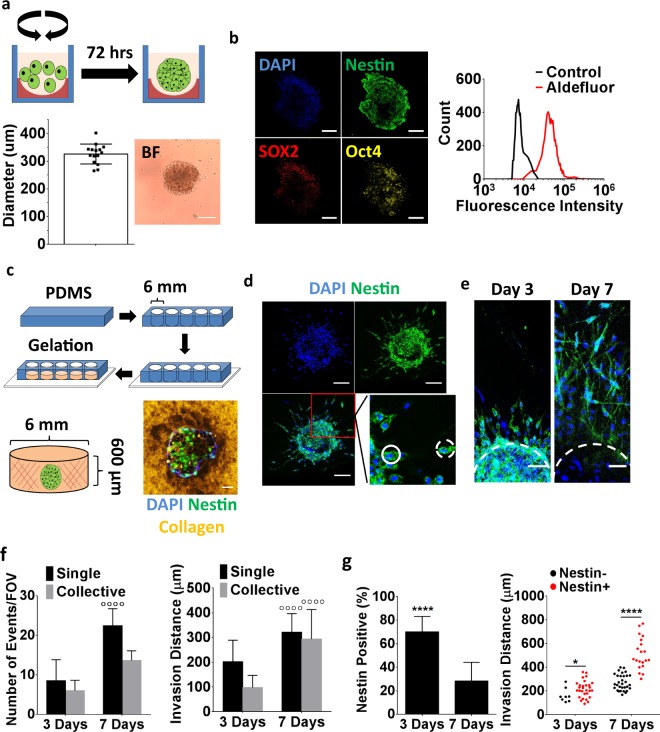
Figure 1.
Analysis of Glioblastoma (GBM) invasion using collagen-embedded GBM spheroids. (a) Schematic of GBM spheroid formation. Patient-derived GBM cells (green) were seeded into agarose (red)-coated plates and allowed to form spheroids during dynamic culture on an orbital shaker. Analysis of bright field images showing uniform spheroid sizes. (b) Cyrosectioning and immunofluorescent staining of GBM spheroids for the stem cell markers nestin, Oct4, and SOX2. Flow cytometric analysis of GBM spheroids for the stem cell marker aldehyde dehydrogenase using the AldefluorTM assay; shown relative to the assay control. Scale bars are 100 μm. (c) Schematic depicting the embedding of GBM spheroids into collagen-filled poly(dimethylsiloxane) (PDMS) microwells that were sealed onto a glass coverslip for imaging purposes. Confocal micrograph of a collagen-embedded, immunostained GBM spheroid. Collagen was imaged in reflectance mode. Scale bar is 50 μm. (d) Confocal images of immunostained spheroids 3 days after embedding showing individual (dashed circle) and collective (solid circle) invasions of nestin-positive tumor cells. Scale bars are 100 μm. (e) Confocal micrographs indicating tumor cell invasion after 3 and 7 days of collagen culture. Scale bars are 50 μm. (f) Confocal image analysis of invasion frequency and distance. ◦◦◦◦ Indicates P < 0.0001 relative to day 3 of the same condition. (g) Confocal image analysis of nestin-positive cells and their respective invasion distance over time. * and **** Indicate P-values < 0.05 and 0.0001, respectively.

