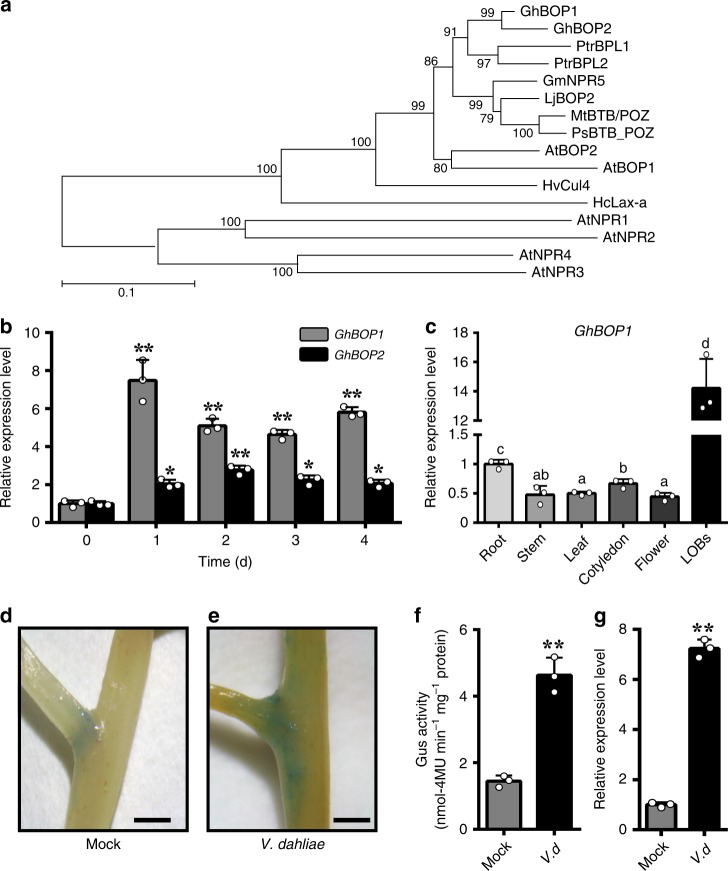
Fig. 1.
Analysis of GhBOP1 specific expression in the lateral-organ boundaries and autonomously expanding expression in response to V. dahliae infection. a Phylogenetic tree of BOP proteins from G. hirsutum and other species. The complete amino acid sequences of BOPs were aligned using ClustalX and assessed with MEGA 5.0 using the neighbour-joining method with 1000 bootstrap replicates. The numbers next to each node represent confidence percentages. Branch lengths are proportional to the amount of inferred evolutionary change. b Expression patterns of GhBOP1 and GhBOP2 induced by V. dahliae. Total RNA was extracted from roots at 0, 1, 2, 3, and 4 day post-inoculation. GhUB7 served as an internal control. Error bars represent the SD of three biological replicates. Asterisks indicate statistically significant differences compared to respective 0 d, as determined by Student’s t-test (*P < 0.05, **P < 0.01). c Transcript levels of GhBOP1 in different tissues of cotton. Total RNA was extracted from root, stem, leaf, cotyledon, flower, and LOBs. GhUB7 served as an internal control. Error bars represent the SD of three biological replicates. The different letters indicate statistically different means at P < 0.05 (one-way ANOVA with a Duncan post-hoc test). d, e, f GUS staining of the LOBs of GhBOP1pro:GUS transgenic plants at 0 day (d) and 3 day (e) after V. dahliae inoculation, and GUS activity analysis (f), respectively. The scale bars indicate 1 mm. Error bars represent the SD (n = 12) of three biological replicates. Double asterisks indicate statistically significant differences, as determined by the Student’s t-test (**P < 0.01). g GhBOP1 expression analysis of the LOBs of seedlings at 3 day after V. dahliae inoculation. Error bars represent the SD of three biological replicates. Statistical analysis was performed using the Student’s t-test (**P < 0.01)

