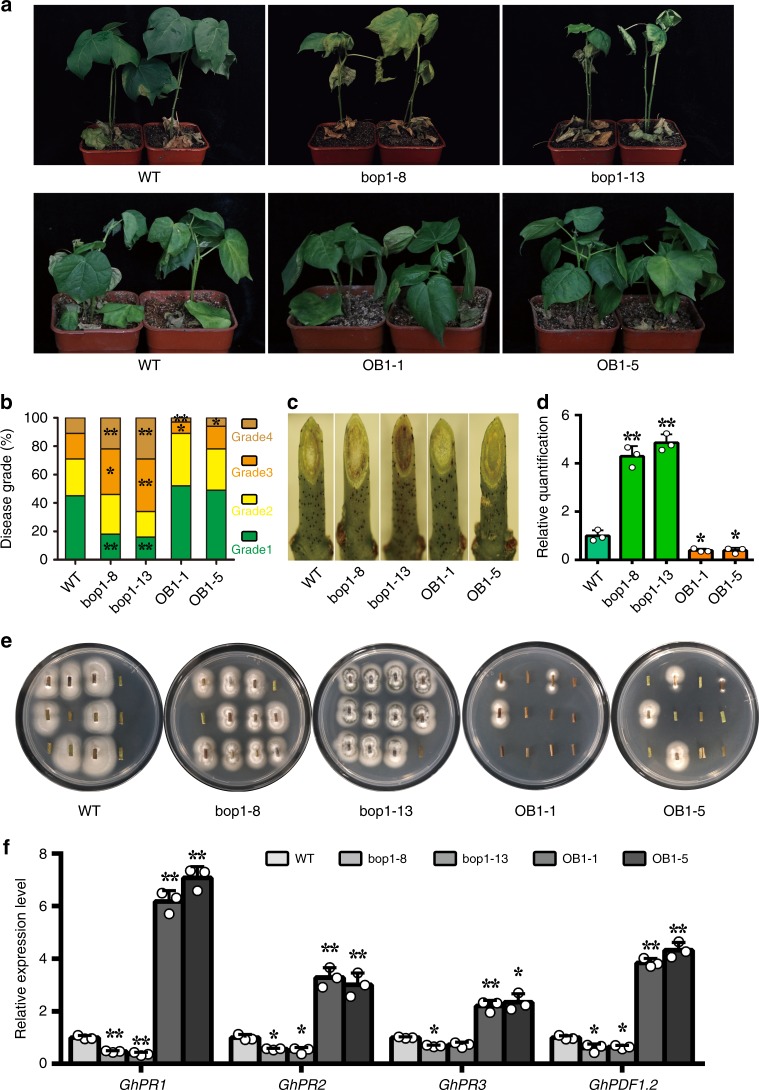
Fig. 2.
GhBOP1 positively regulates plant defence against V. dahlia. a The disease symptoms of WT, GhBOP1-RNAi, and -OE plants inoculated with V. dahliae. Images were obtained at 18 day after pathogen inoculation. b Disease grade analysis of the infected plants at 18 day after pathogen inoculation. The asterisks indicate statistically significant differences compared to corresponding disease grade of WT, as determined by the Student’s t-test (*P < 0.05, **P < 0.01). c The oblique sections of stems revealed the disease symptoms in the vascular tissue of WT, GhBOP1-RNAi, and -OE plants. d Relative quantification of the fungal biomass in infected stems. qPCR analysis was conducted to compare the DNA contents between the ITS gene (measure of the fungal biomass) of V. dahliae and the UB-7 gene of cotton (for equilibration) at 18 day post-inoculation. Error bars represent the SD of the three biological replicates. The asterisks indicate statistically significant differences, as determined by the Student’s t-test (*P < 0.05, **P < 0.01). e Fungal recovery assay. The stem segments of inoculated plants were placed on PDA medium, and photographs were obtained at 4 day after culture. f Relative expression analysis of four resistance-related genes in WT and transgenic plants after V. dahliae inoculation. GhUB7 served as an internal control. Error bars represent the SD of three biological replicates. The asterisks indicate statistically significant differences compared to corresponding gene expression level in WT, as determined by the Student’s t-test (*P < 0.05, **P < 0.01)

