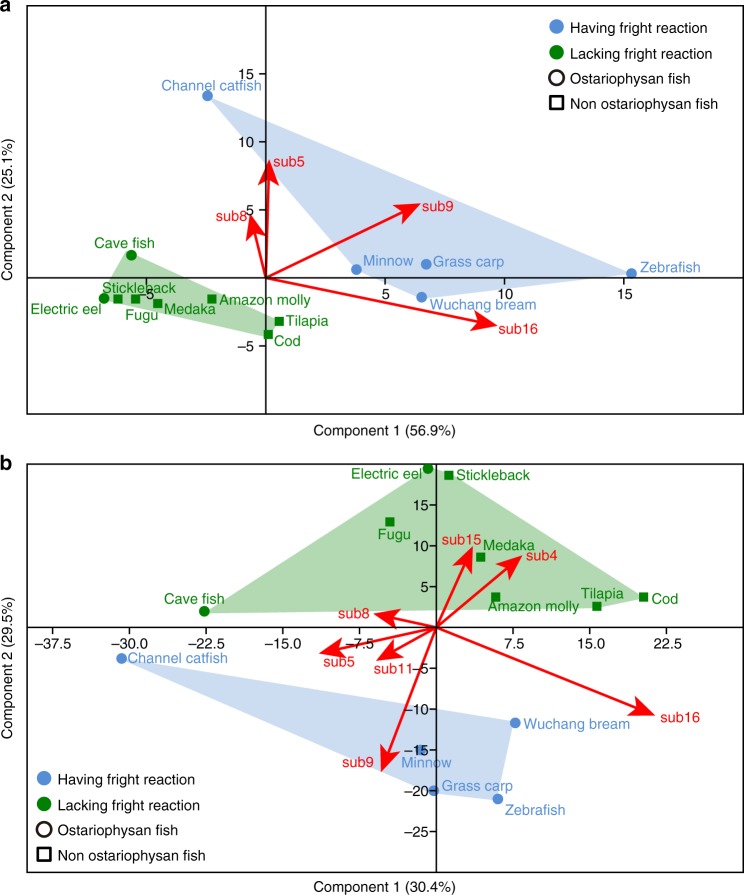
Fig. 4.
Scatterplots showing the results of the principal component analysis (PCA) analysis of intact OlfC genes with their respective OlfC gene subfamilies. Both OlfC gene counts (a) and proportion (b) across each subfamily are shown. First and second axes explain more than 82% and 59.9% of the variance within the data set. Blue polygons represent fishes having fright reaction and green polygons represent fishes lacking fright reaction. Red arrows represent the contribution of particular subfamilies on the positioning of each species on the plots

