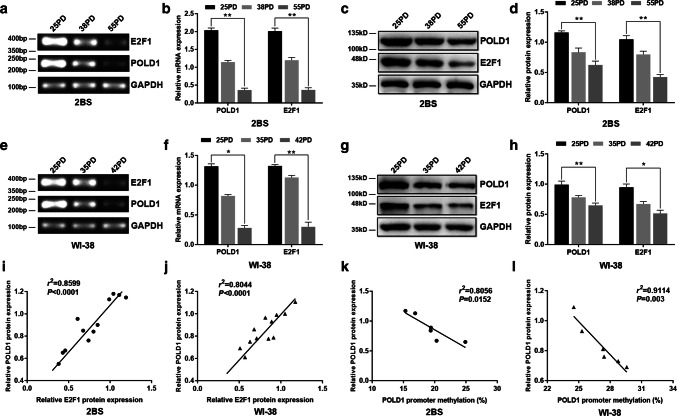
Fig. 3.
The alterations in the expression levels of POLD1 and E2F1 in replicative senescence and the relationship between the POLD1 expression level and E2F1 expression level as well as the POLD1 promoter methylation level. a, b The mRNA expression levels of POLD1 and E2F1 in different PDs of 2BS cells. c, d The protein expression levels of POLD1 and E2F1 in different PDs of 2BS cells. e, f The mRNA expression levels of POLD1 and E2F1 in different PDs of WI-38 cells. g, h The protein expression levels of POLD1 and E2F1 in different PDs of WI-38 cells. GAPDH was used for normalization of the data. Values represent the mean ± SD. The data were analyzed using one-way ANOVA, with three independent experiments in each group; *p < 0.05, **p < 0.01, vs. the young cells (25PD). i, j Correlation between the relative POLD1 protein expression level (Y-axis) and the relative E2F1 expression level (X-axis) in 2BS and WI-38 cells. Analysis for the correlation of E2F1 and POLD1 expression with Spearman’s rho method. k, l Correlation between the mean relative POLD1 expression level (Y-axis) and DNA methylation level (%) of the POLD1 promoter (X-axis) in 2BS and WI-38 cells. The correlation was determined using Pearson’s correlation coefficient

