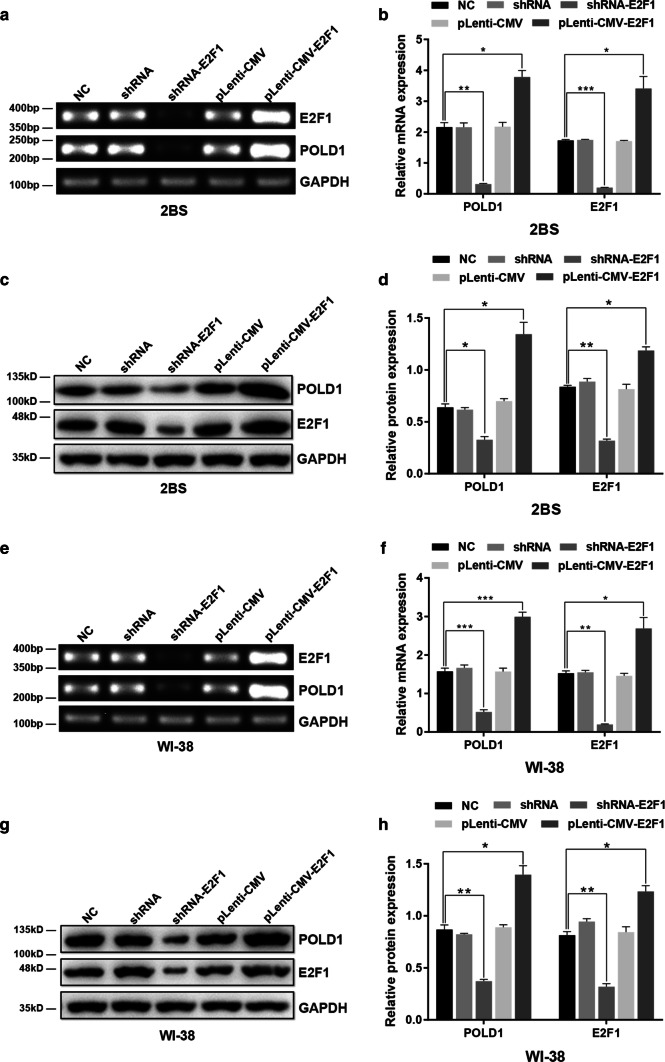
Fig. 5.
The effect of E2F1 on the expression of POLD1. 38PD 2BS and 35PD WI-38 cells were transfected with shRNA targeting E2F1 and E2F1 expression lentivirus. RT-PCR and western blotting were used to analyze the expression levels of E2F1 and POLD1. Control shRNA and pLenti-CMV were used as negative controls, and a bar graph indicates the relative expression levels of POLD1 and E2F1, normalized to GAPDH. The data were compared by one-way ANOVA, with three independent experiments in each group; *p < 0.05, **p < 0.01, ***p < 0.005, vs. the normal control (NC)

