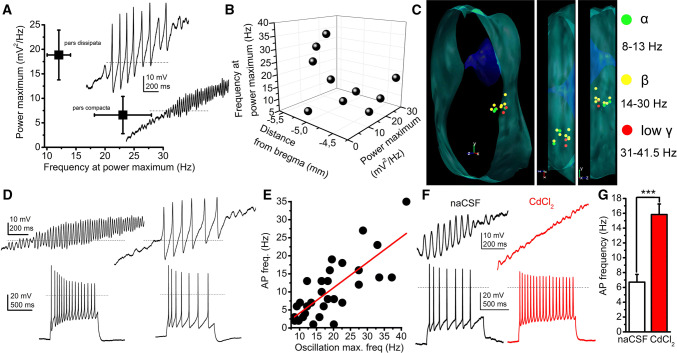
Fig. 6.
High threshold membrane potential oscillations (HTOs) of PPN neurons determine action potential firing frequencies. a Average frequencies of the power maximum plotted against the oscillation frequencies recorded at the power maximum of neurons in the pars compacta (below) and pars dissipata (above). Original voltage traces (right) were elicited by depolarizing ramp current injections in the presence of TTX. Dashed lines indicate 0 mV. b Spatial distribution of HTO frequencies at peak power maximum and power maxima. c Distribution map of oscillatory frequencies at power maximum (green: theta/alpha; yellow: beta, red: low gamma frequency range). d Relationships of oscillatory frequencies and action potential firing frequencies. Upper row: HTOs elicited with depolarizing ramp injection. Lower row: action potential trains recorded from the same neurons as upper traces, with 120 pA depolarizing square pulses. e Action potential firing frequencies plotted against oscillatory frequencies at power maximum (black circles: individual data, red line: linear fit). f Changes of firing frequency with application of 50 µM CdCl2. Upper traces: HTOs under control conditions (black) and in the presence of CdCl2 (red), recorded from the same neuron. Lower traces: action potential trains recorded under control conditions (black) and in the presence of CdCl2 (red). g Statistical comparison of action potential firing frequencies without and with CdCl2 (average ± SEM)

