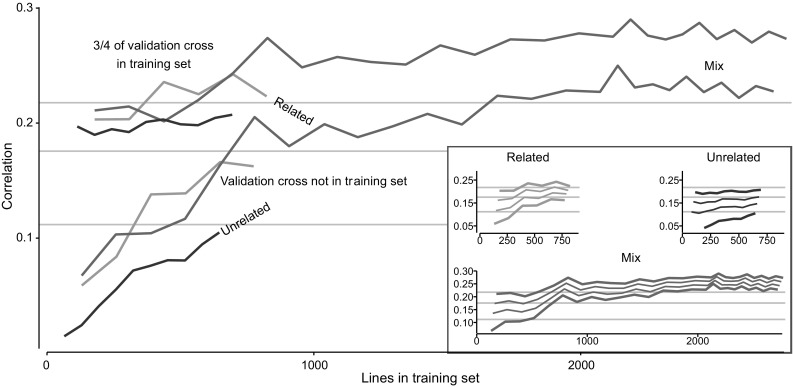
Fig. 5.

Prediction accuracies increased when the validation cross was partly in training set or had its related crosses in training set. Results show average prediction accuracies for six validation crosses. Lines show prediction accuracies when training set is comprised of related crosses (green solid line), unrelated crosses (purple line), or a mix of both (blue line). Lower set of lines show prediction accuracies when validation crosses were not included on the training set; upper set of lines show prediction accuracies when validation crosses were included in the training set with 3/4 of lines. Grey horizontal lines show average prediction accuracy using only 1/4, 2/4 or 3/4 of validation cross as training set. Inserted figure shows the increase in accuracy when adding 1/4, 2/4 and 3/4 of the validation group to the training set. The thick lines in the inserted figure denote the lines of the main figure (color figure online)
