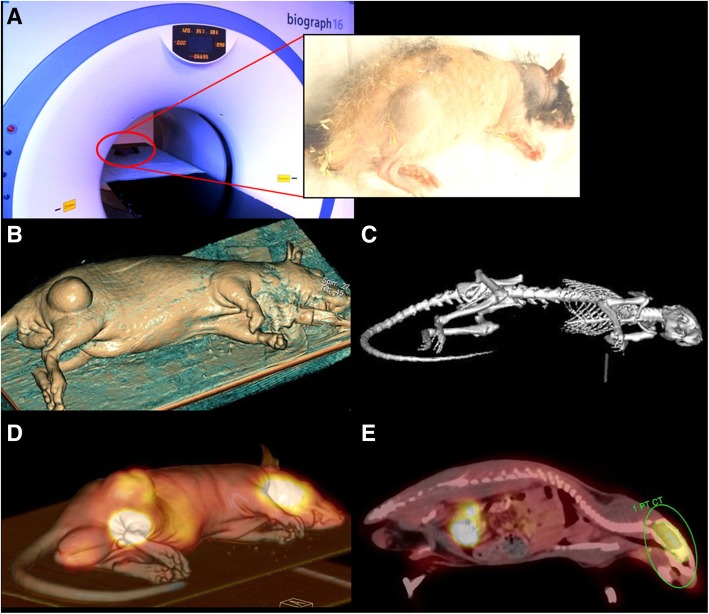
Fig. 2.
a–e Clinical scanners for preclinical research—[18F]FDG-PET/CT. a Tumor-bearing nude rat while scanning in PET/CT “biograph 16 Hi-Rez” (Siemens Healthineers). Narcotized rat carrying the tumor at the rat’s right lower limb. b Reconstruction using soft tissue windowing by CT data. High image quality visualizes even surface details using clinical scanners, e.g., the tumor at the rat’s right lower limb. c Reconstruction using bone windowing by CT data. d 3d rigid Fusion of [18F]FDG-PET and CT data. Position as in a–c with co-registration of [18F]FDG-PET. High [18F]FDG activity in four locations, highest at brain and urinary bladder. Less intensity can be seen in the abdominal part, near to the primary [18F]FDG injection and at the tumor site at the right lower limb. e Sagittal view of [18F]FDG-PET/CT scan. Green region of interest to analyze [18F]FDG-uptake in the brain

