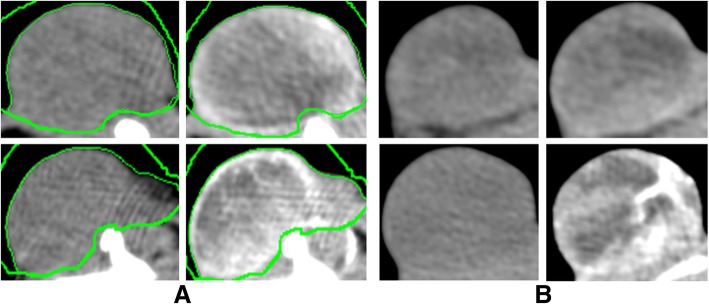
Fig. 6.
Imaging tumors with CE-CT and native CT. Panel a and b show details of xenograft tumors for cell line A549 and H1299, respectively. The upper and lower rows depict images for non-co-transplanted and co-transplanted tumors, respectively. The left and right columns in a and b depict images from native and contrast-enhanced images. Compare the different degree of contrast enhancement between non-co-transplanted (upper row) and co-transplanted (lower row) tumors. a Upper row: non-co-transplanted tumor with moderate contrast enhancement from native (left column) to contrast-enhanced (right column) image. Lower row: co-transplanted tumor with high contrast enhancement from native (left column) to contrast-enhanced (right column) image. b Upper row: non-co-transplanted tumor with modest contrast enhancement from native (left column) to contrast-enhanced (right column) image. Lower row: co-transplanted tumor with high contrast enhancement from native (left column) to contrast-enhanced (right column) image and vessel within the tumor becoming visible in co-transplanted contrast-enhanced image

