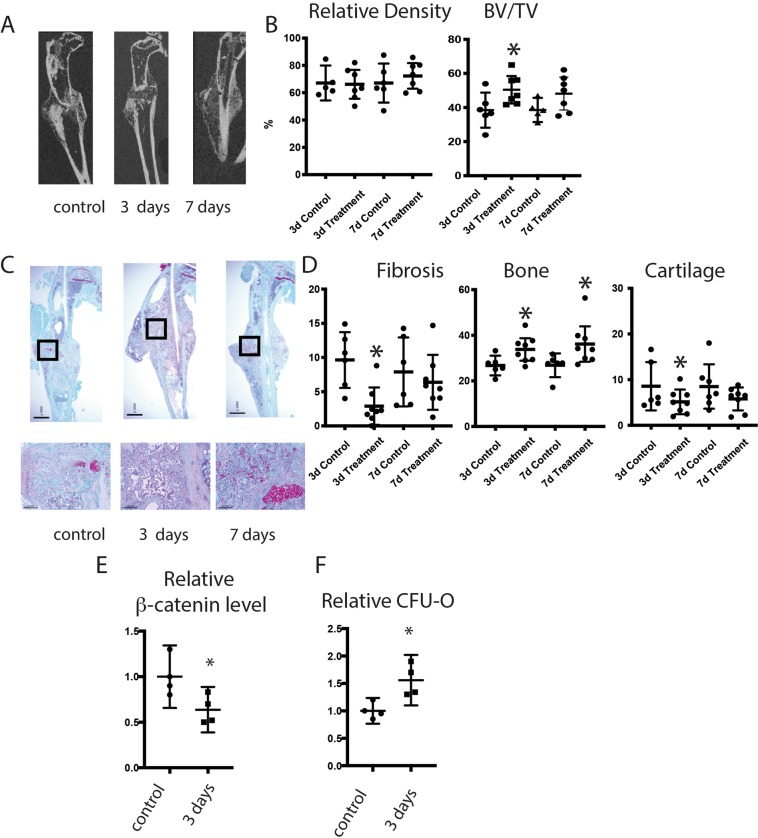
Figure 3.
Tankyrase inhibition increases osteogenesis during fracture healing in old mice. (A) Representative micro-CT images of headlining tibia fractures 21 days after fracture. (B) Graphical representation of relative density or bone volume/total volume (BV/TV) in %. Each data point is shown as well as means and 95% confidence intervals. (C) Representative histologic images from the tibia of an old mouse 21 days after fracture. (D) Graphical representation of percent fibrosis, cartilage, or bone. Each data point is shown as well as means and 95% confidence intervals. An asterisk over a data point indicates a significance p < 0.05 compared to controls.

